It’s the end of March, and it’s time for the Q1 2024 version!

We continuously improve our platform and listen to your requests in order to keep Samurai the best platform for options investors and help you keep your edge in the market.
For this version, we’ve made considerable improvements to the scanner in anticipation of our custom strategy scanner. We’ve improved the home page to be more ‘card’- based and added breadcrumb-based navigation to help you quickly dive in and out of the results without losing context and information. Additionally, we’ve added more Excel templates and new data points, improved the platform, and crushed bugs.
In this version:
- A new dashboard for the scanner
- Breadcrumb-based navigation
- Reverse DCF Excel suite
- Improved ATR vs. Strike
- Bug fixes and improvements
A new dashboard for the scanner
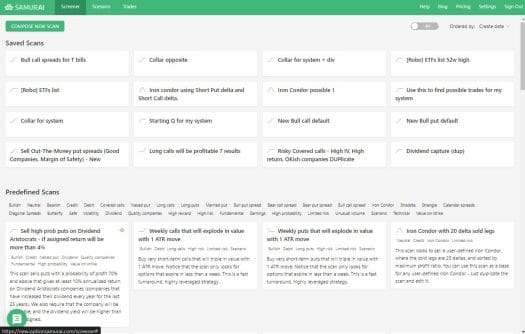
We’ve implemented a new ‘All scans’ page that allows you to see lists of all your saved scans and our predefined scans. This page will allow you to see all your scans in a bird’s-eye view and serve as a starting point for the scanning process. We welcome your feedback to help make this page even more useful.
Breadcrumb-based navigation
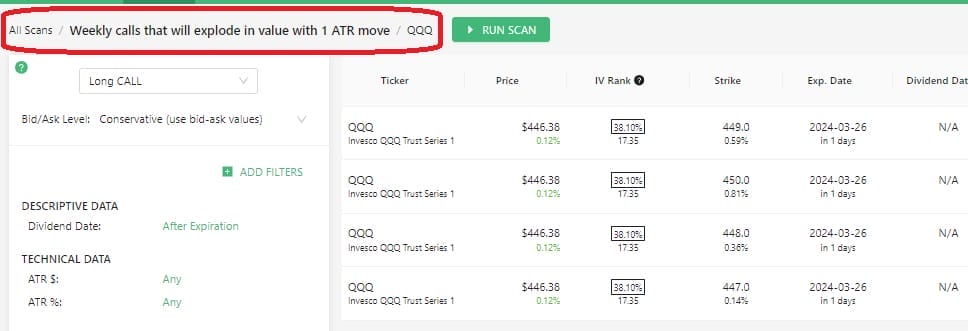
We’ve implemented another significant improvement to our scanner’s navigation. Now, you can drill down into the scan and go back without losing the context. This will allow for faster analysis and advanced interactions with the potential trades you find in the scanner. For example, You can run a scan, focus on one symbol to see all the options for that scan, open the analysis tab or send it to the trade log, and go back to the scan without losing the context of the scan.
Reverse DCF Excel suite
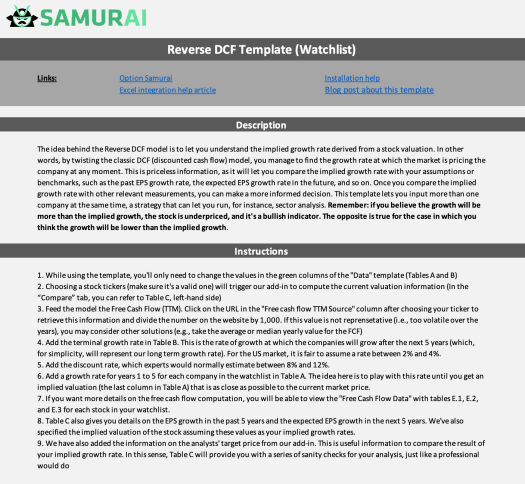
Reverse DCF is a financial model that allows you to see the market’s implied growth for a stock. You can then decide if your growth assumptions are higher (look for bullish positions) or lower (look for bearish positions) than the market’s growth. We’ve built three templates that allow you to analyze quickly and gain unique insights into the market. The templates+ links:
- Reverse DCF analysis
- Reverse DCF analysis for competitors
- Reverse DCF analysis with simple options integration
Since these templates are in Excel and use our plugin integration, you can get the most recent data directly in Excel and customize the template to fit your needs.
Improved ATR vs. Strike
Average True Range (ATR) is a technical indicator of volatility. It measures how volatile a stock is. When we combine this metric with the distance of the strike from the current price (moneyness), we can get a standardized measure for distance from your strike. This is very useful when selling options and comparing different assets.
Bug fixes and improvements
We’ve continued to improve the platform and squash bugs. This version deploys work that includes better calculations, improvements in our Excel integration, scan and trade-log calculation, and more.

