Backing your options trading with a fundamental analysis can give you an edge in the market. You can achieve this result in only a few minutes by using our Reverse DCF Option Strategy Excel Template. With this template, you can easily calculate the implied growth rate of a stock and build different option strategies based on your analysis. This can help you make informed trading decisions and increase your chances of success in the market.
Key takeaways
- The Reverse DCF model can help you find potentially undervalued or overvalued stocks.
- This Excel template makes it easy to calculate the implied growth rate and build option strategies using the Reverse DCF model.
- The template includes 3 popular option strategy families: long call/put, credit spreads, and naked put/call.
- We created this template to help you compare option trades with trade ideas that agree with your analysis.
What Is the Reverse DCF Model?
As we saw in our previous discussion on the topic, the Reverse Discounted Cash Flow (DCF) Model is a tool used in financial analysis. Its purpose? To determine the implicit growth rate that we can deduce from a company’s current stock price.
We already shared two detailed articles on the Reverse DCF Excel template and on the comparative analysis you could perform with it.
This model uses the same principles as a traditional DCF model but works in reverse. Instead of predicting future cash flows and discounting them to the present to find a stock’s fair value, it starts with the stock’s current market price.
If you’re familiar with Keynes’ Beauty Contest analogy, the Reverse DCF model works in a similar way. Instead of guessing what others will think is the prettiest contestant, we try to understand what others are predicting.
Why does this matter? Simply put, if you know what growth rate is implied in a stock’s current price, you can compare it to your own expectations and adjust your investment decision accordingly.
If the implied growth rate in the market is lower than your expected growth rate, the stock may be undervalued. On the other hand, if the implied growth rate is higher than your expected growth rate, the stock may be overvalued.
Finding the Implied Growth Rate with Our Template
Our Excel Template for Reverse DCF analysis is designed to make your life easier, putting together stock picking and option picking. You can find the template at the bottom of this page. Once downloaded, get familiar with the “Instructions” tab, or simply follow our guide below.
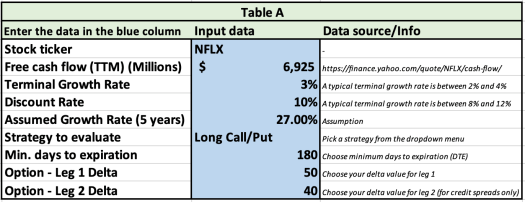
The template works like a simplified Sudoku game. Fill in the blue column of the “Data” template (Table A). Start by choosing a valid stock ticker. This will trigger our add-in to calculate and display the current valuation information in Table B.
Next, provide the Free Cash Flow (TTM). To find this, click on the URL in the “Data source/info” column after selecting your ticker. This takes you to the Yahoo! Finance page for the company where you find the figure at the bottom left of the table. Convert this into millions by dividing by 1,000. Here is an example on Netflix (NFLX):
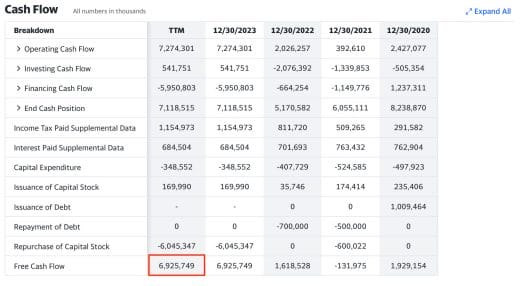
Note that, sometimes, the Free Cash Flow (TTM) value won’t necessarily be representative of a company’s business activity. For instance, when you notice great volatility in this value over the years, you could consider other solutions (e.g., consider the average yearly value, the median, etc.).
Then, input the terminal growth rate. This is essentially the company’s growth limit after the next 5 years. For simplicity, we’ll use this as our long-term growth rate. A rate between 2% and 4% is generally acceptable in the US market. So, 3% is a good balance.
Next, add the discounted rate, which is typically estimated between 8% and 12%. Opting for the average value of 10% is a reasonable choice.
Now, start inputting a growth rate for years 1 to 5 in the model. Change this value until you get close to the current stock price. This operation helps you find the implied growth rate easily.
At this point, input the option-related data. Choose a strategy group to evaluate (Long Call/Put, Credit Spread, or Naked Sell) and the minimum days to expiration for your trade (our default value is 180 days). Consider that you are running a fundamental analysis, hence it is likely that your output won’t be relevant for the short term.
Finally, add the delta of the options you want to evaluate. Notice that you can control both the first leg delta (for all strategies) and the second leg delta (for the Credit Spread strategies).
Table A for NFLX should look something like this:
Option Trading Strategies with the Reverse DCF Model
Now, let’s move on to Table F. Here, you’ll find all the data you need about option strategy ideas.

But before we get into that, it’s important to understand what drives a bullish or bearish strategy. This is where Table C comes in handy.
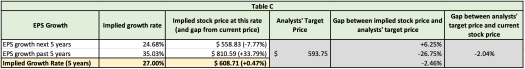
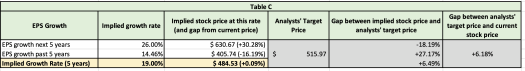
Table C allows you to compare the current stock price and the implied growth rate with several key metrics: the expected yearly EPS growth rate and the implied stock price when using this rate for the model; the past yearly EPS growth rate and the implied stock price when using this rate for the model; and the analysts’ target price.
Here’s how to interpret this:
- If the implied stock price (derived from the expected EPS growth rate) is higher than the current stock price, that suggests a bullish strategy is in order.
- Conversely, if the implied stock price is lower than the current stock price, a bearish strategy is indicated.
Note that the template also allows you to override the reasoning above by simply inputting either “Bullish” or “Bearish” in the “Force strategy direction” field. For instance, you may want to use this feature to assess an option strategy even in the case a company does not have an expected EPS growth rate.
You can also play around with the strategy group to explore different strategy ideas. Try changing the minimum time distance to the expiration date or the option’s delta. This way, you can see how various factors influence the potential strategies.
To make things even easier, we’ve included some additional information: an indication of the bid-ask spread, maximum loss, maximum profit, and profit probability for each strategy. This should help you sort through the trades and select the one that best aligns with your risk tolerance and investment objectives.
Building an Option Strategy on META with the Reverse DCF Model
Let’s now demonstrate how to use our template to find trade ideas on Meta Platforms (META).
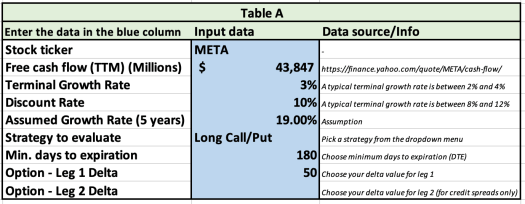
First, input “META” as the ticker in Table A. Next, fill in the terminal growth and discount rates. For the US market, we often use 3% and 10% respectively.
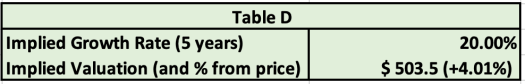
Third, we need to figure out the assumed growth rate. Start by trying 25%. You’ll notice in Table D that the implied valuation is quite a bit off from the current stock price.

Decrease this to 20%. We’re not quite there, so we need a higher value.
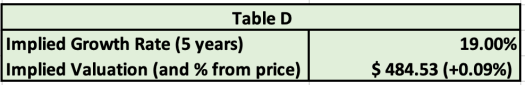
Let’s try with a little less: 19%. You’ll find that it matches closely with the implied growth rate for META. And just like that, you’ve performed a fundamental analysis of a popular company in under a minute.
Moving on, select the strategy to evaluate. We’ll start with something simple like a Long Call/Put strategy. If you’re unsure about the expiration date, stick with the template’s default minimum of 180 days and focus on options with delta equal to 50.
Here is how our Table A looks like now:
Finally, refer to Table C. If the implied stock price (calculated using the expected EPS growth rate) is higher than the current stock price, the template will suggest a bullish strategy.
In the following sections, we’ll explore three trade ideas based on this type of analysis.
Long Call
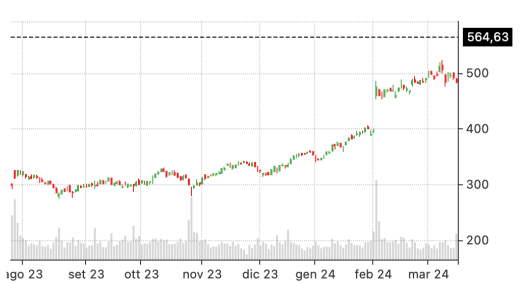
Let’s begin with the long call strategy on META as the one you found on the template. Consider this scenario: buying a $520 call with a 6-month expiry. The P&L below shows that META needs to close above $564.63 when the call option expires.
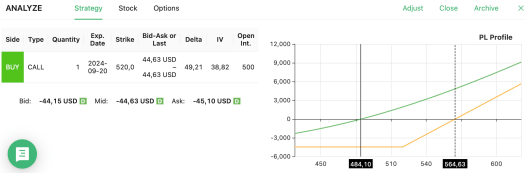
Consider that this breakeven price would represent an all-time-high in META history. However, give the fact that META has been in an uptrend for a while, you may like your odds here:
However, you might make a profit before expiration if META trades in the $500s. Selling before reaching the breakeven price could be a wise decision. As conditions change, you might need to redo the reverse DCF analysis. Your initial breakeven price might seem too high.
Conversely, if your outlook on META becomes more bullish, holding the options until expiration could be the right choice.
Bull Put Spread
Next, let’s take into account the bull put spread suggested by the template. Here, you’d sell a $520 put and buy a $480 put. The P&L profile on our options screener is helpful for this scenario. You’ll see that the breakeven price to make a profit is lower at $498.20, compared to the long call case.
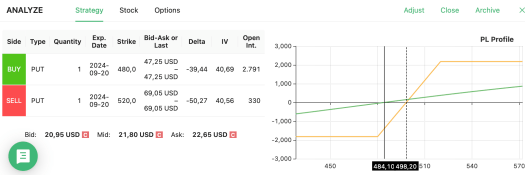
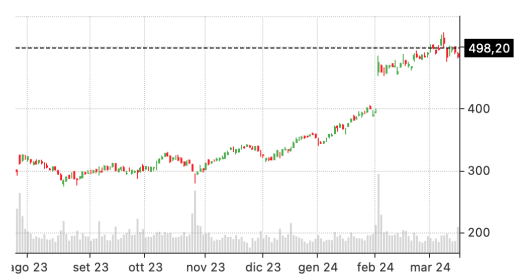
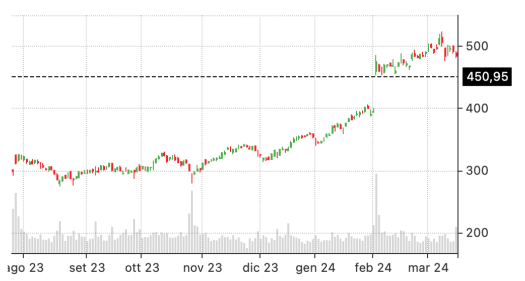
The trade-off is that your profits are capped but so are your losses in the worst-case scenario. This strategy might seem more viable as META already trades above the breakeven price. With META on a bullish trend (again, look at the price chart below), it’s possible your breakeven price will soon be far behind.
Naked Put
Finally, we should examine the naked put trade from our template. Selling a $520 put contract with a 6-month expiry would be the move here. Your breakeven price is even lower in this case, requiring META to close above $450.95 for profit, as you can see from the chart below:
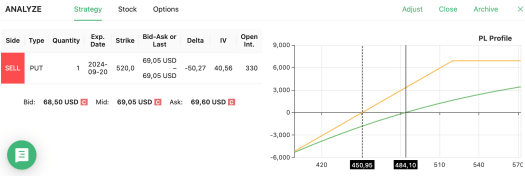
The drawback, as evidenced by the P&L chart, is the possibility of unlimited losses against capped profit. Despite the risk, this move could increase your likelihood of profit compared to a long call strategy. The price chart indicates a support level at your breakeven price, which META overcame after its latest earnings report. However, disappointing news or earnings could reduce your chances of profit, so keep following the stock and its related news.
How should you choose among these strategies? While the choice is entirely up to you, here are a few tips:
- Go for a long call (or long put) whenever you feel strongly bullish (or bearish) about a stock.
- A naked put (or naked call) will do the trick when you expect a sideways or bullish (bearish) movement in a stock.
- A credit spread will be the solution that stands in between the above two scenarios. In this way, you’re capping your losses and profits with a generally more reasonable breakeven price compared to the long call case.
Note that, in probably less than 5 minutes, you have managed to perform a full reverse DCF analysis and spot a few strategies to trade options based on this methodology. If you like this type of analysis, you can check out our stock valuation spreadsheet to gain even more insights on your favorite stocks.
Download the Template:
DOWNLOAD THE REVERSE DCF OPTION STRATEGY TEMPLATE HERE
Read more about how to import Options data to Excel and Google Sheets

