Among the many tools you should have in your financial analysis arsenal, our Excel Reverse Discounted Cash Flow (DCF) template stands out as a crucial asset. This powerful tool allows you to uncover the implied growth rate of a stock by working backward from its current market price. Why should you care about this unique approach, and how can it inform your investment decisions in real-life scenarios? Let’s delve into a specific case study to explore the insights it offers.
Key takeaways
- The reverse DCF model lets you derive the implied growth rate of a stock based on its current market price.
- You want to know the implied growth rate because this number tells you what the market thinks of a stock and company. This will help you make an informed decision on whether the stock is underpriced, overpriced, or fairly priced.
- Our Excel template lets you easily input data and perform scenario analysis to make more informed investment decisions.
Reverse DCF Unpacked
The DCF model is a valuation method that forecasts a company’s future cash flows, discounts them back to their present value, providing an estimate of the intrinsic value of the company. It helps investors determine whether a stock is undervalued or overvalued based on these projections.
If the estimated intrinsic value (or “fair value”) is higher than the current market price, the stock may be considered undervalued, indicating a potential buying opportunity. Conversely, if the estimated intrinsic value is lower than the market price, the stock may be overvalued, suggesting caution.
Now, where does the Reverse DCF fit into this? It reverts the script. Instead of predicting the future, it uses the current market price, assumes it as the model’s fair value, and works backward to determine the growth rate already baked into the stock price. This gives investors a unique perspective on market expectations.
In essence, the significance of the Reverse DCF in investment analysis lies in its ability to provide a reality check on market assumptions about a company’s growth. It helps investors discern between over-optimistic or pessimistic market expectations, aiding in more informed investment decisions.
While a DCF model takes growth assumptions and gives you a fair price. The reverse DCF model takes the current market price and tells you what the growth assumptions (implied growth) were. Now, you just need to decide if you agree with this growth or not.
With a DIY mentality, rather than relying on news or other people’s opinions, this tool empowers you to assess market value independently. Now, thanks to this information, you can make informed decisions, whether you agree or disagree with the implied growth rate, potentially leading to profitable trades.
This template is similar to the stock valuation spreadsheet we created in the past that uses the PE-EPS model. You can download both and see which one you like better.
Furthermore, if you like the idea of trading using the Reverse DCF method, you can enjoy our other templates based on this idea (click below to open the articles and download the templates):
- Reverse DCF Watchlist Template (ideal for sector-based comparative analyses)
- Reverse DCF Option Strategy Excel Template (a way to follow up on the Reverse DCF analysis result and evaluate different option strategies based on the model’s output).
Entering the Values
To simplify your Reverse DCF analysis, we have designed an ad-hoc template to run on Excel. With this Excel Template – you can extract the implied growth in minutes. After downloading it, we suggest you take a look at the “Instructions” tab.
Entering values into our Reverse DCF Model template is like playing a simplified game of Sudoku. Only the blue column of the “Data” template (Table A) requires your input.
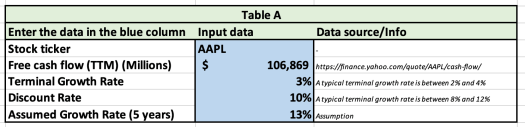
Start by choosing a valid stock ticker. This action will prompt our add-in to calculate the current valuation information automatically and display it in Table B.
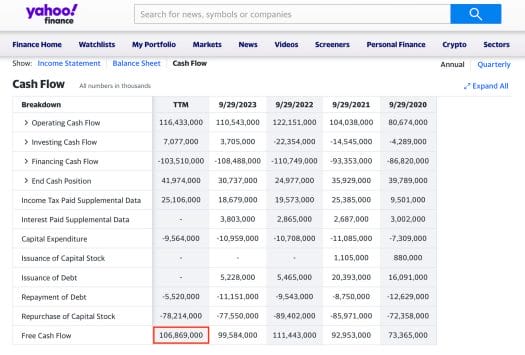
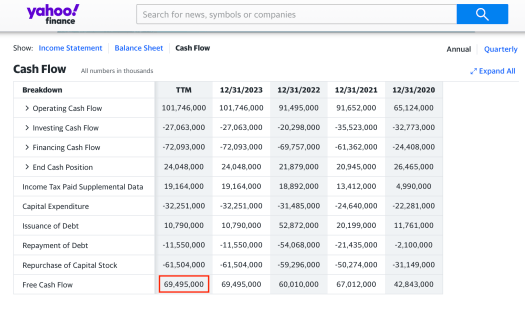
To get this model rolling, you need to provide the Free Cash Flow (TTM). Tracking down this information isn’t a scavenger hunt. After selecting your ticker, click on the URL in the “Data source/info” column.
The link will open the Yahoo! Finance page for the company. Locate the Free Cash Flow (TTM) at the bottom left of the table and remember to convert this figure into millions (simply divide by 1,000). In the image below, we have highlighted the position of the value on the Yahoo! Finance page for Apple (AAPL):
Next up is the terminal growth rate. Think of this as the speed limit for the company’s growth after the next 5 years. For simplicity’s sake, we’ll consider this our long-term growth rate. In the context of the US market, a rate between 2% and 4% is generally acceptable. So, choosing 3% strikes a good balance.
Now, let’s tackle the discounted rate, which experts typically estimate to be between 8% and 12%. Hence, opting for the average value of 10% is a reasonable choice.
At this point, you can start inputting a growth rate for years 1 to 5 in the model. The main idea is very simple: change this value until you get very close to the current stock price, an operation that will help you find the implied growth rate of the company pretty easily.
Now that we’re done with the input, let’s take a look at the output analysis in the section below.
Playing with the Model
Now, look at Table D. After playing around with the growth rate, you finally find the percentage value that brings you close to the current stock price.
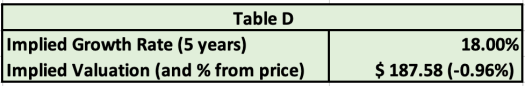
Notice that, for the stock analyzed above (in this specific case, AAPL), the distance from the implied valuation at a 18% growth rate is only 0.96% lower than the stock price. What you should derive from this is that, at the moment, the market is estimating a 18% growth rate for AAPL.
Now that you know what market-implied growth is, do you agree with it? Will AAPL (in this case) grow 18% each year for the next five years?
- If you think the answer is Yes, or don’t know – Then, we can assume that the stock is priced fairly. There is no real edge in this trade.
- If you disagree with this growth rate – you might have a trade opportunity. If your opinion differs from the market opinion and you are right – this can be the foundation of a very profitable trade.
- If you think this growth rate is too high – you might take a bearish position.
- If you think the growth rate is too low – you might take a bullish position.
As option traders, we can use options to implement a complex trade, a high probability trade, or/and a limited risk trade. This model gives us a direction, and according to our conviction and edge, we can implement the right trade.
Bonus – The Implied Growth Rate vs. Other Evidence
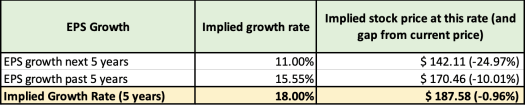
For a deeper analysis, take a peek at Table C. Our add-in has populated this table with information about the past 5-year EPS growth and the projected EPS growth for the next 5 years. Additionally, we’ve calculated the implied valuation of the stock assuming these growth rates.
As a general rule, the current stock price usually hovers close to the implied valuation based on the expected EPS growth for the next 5 years, but there are exceptions (start-up companies, high-growth companies, or those with declining EPS results).
In the same table, on the right-hand side, we’ve also included analyst target prices. This is another benchmark to gauge the accuracy of your implied growth rate. In the gray cells of the table, you’ll find the following details:
- The analyst’s target price
- The percentage difference between your implied valuations and the analyst target price
- The percentage difference between the analyst target price and the current stock price.
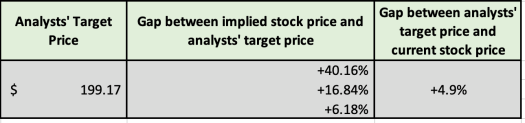
Table C essentially acts as a fact-checker, providing crucial checks and balances for your analysis.
Adjusting the growth rate can significantly impact the valuation. Higher growth rates increase the valuation, while lower rates decrease it. Remember, though, that overly optimistic or pessimistic growth rates can skew the results. It’s always best to base your assumptions on reliable data and sound reasoning.
There are various use cases in which you may want to go back to fundamental analysis to evaluate a stock, such as:
- A shocking earning report: After a sudden drop or rise in the stock price, you may want to check if your growth rate needs an adjustment.
- Analysts’ upgrade or downgrade operations: Every once in a while, you may want to check the valuation in light of a new analyst forecast.
- Major overall market move: If the S&P 500, Nasdaq, or Dow Jones index experiences a considerable change, you may want to check that your company’s growth rate assumptions do not contradict it.
- Compare the market vs your assumption: You could also use the model to run a quick analysis of the implied growth rate compared to your growth assumption and understand the potential upside or downside opportunity.
In all of the above cases, you’ll go to Table A, adjust the growth rate, check whether the free cash flow is still valid, and then head back to table C. This process should give you a clear picture of how valid your original assumption was and whether or not it needs tweaking.
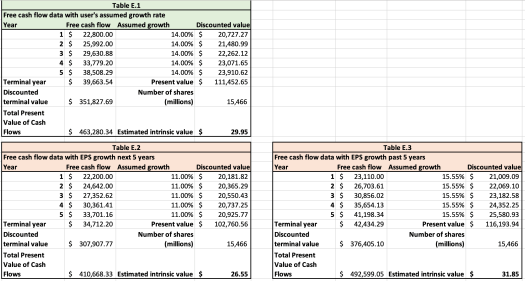
Looking at the Reverse DCF Model Behind the Scenes
If you want to learn more about what’s happening behind the scene (i.e., the breakdown of the free cash flow computation), head to the “Free Cash Flow Data” section, where tables E.1, E.2, and E.3 are located.
A Real-Life Example – The Market Reaction to GOOGL Earnings in Q4 2023
Let’s take Alphabet (GOOGL) as an example. Recently, the stock saw a 7.5% drop despite a solid earnings report where GOOGL beat analysts’ EPS estimates. This scenario raises questions about the market’s rationality and provides us with an opportunity to use the Reverse DCF model to understand Alphabet’s implied growth rate.
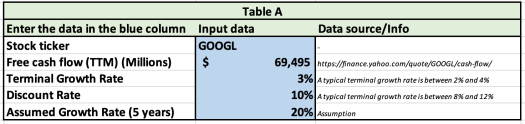
First, we go to Table A and enter “GOOGL” in cell C4. We then head over to Yahoo Finance to find the Free Cash Flow (TTM) figure, which we put into cell C5. In this case, we enter 69,495, as indicated by Yahoo! Finance.
Next, we input the average discount rate of 10% and long-term growth rate of 3% into cells C6 and C7, respectively. These numbers are generally accepted for the US market. Finally, let’s begin with a 20% number for the growth rate in cell C8, as you can see below:
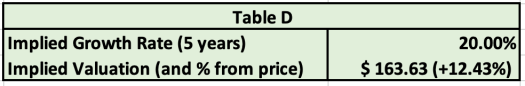
Take a look at Table D, how far are we from the current market price? As you can see below, a 20% growth rate would put you 12.43% above the current stock price for GOOGL, this means we need to change the growth rate to get closer to the current valuation.
We want the implied valuation to be lower than the value we have just obtained, so we input a lower growth value in C8, such as 15%:
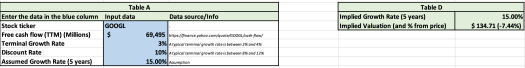
Note that we’re 7.44% below the current stock price. This means that, while 20% is a too-high growth rate, 15% is too low. Let’s give 17% a try:
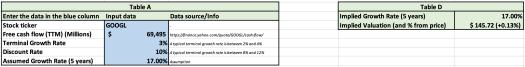
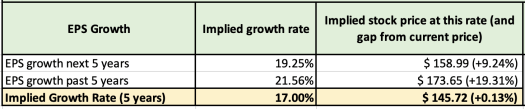
At a 17% growth rate, the implied valuation is only 0.13% higher than the current GOOGL stock price. Therefore, in only a few seconds, we’ve managed to estimate the implied growth rate for the company at 17%, based on GOOGL current price.
The next step is to use Table C to run a sanity check on this 17% growth rate. Specifically, you could notice that the anticipated EPS growth rate for the next 5 years is 19.25%, while the same rate for the past 5 years was 21.56%. Both these rates were higher than 17%, which may lead you to think that the market’s implied growth rate for GOOGL is too low at the moment (see the left-hand side of Table C below).
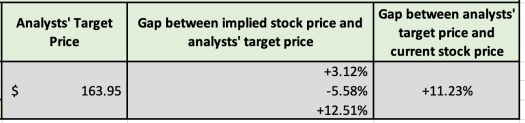
Another check you should definitely run is comparing the current stock price (and the 3 implied valuations above) with the analysts’ target price. For this purpose, you can refer to the right-hand side of Table C (image below), which would lead you to conclude that analysts too expect a higher price for GOOGL:
Even with a short example such as this one, you can see that the Reverse DCF model is a valuable tool for investors. With proper adjustments and reasonable assumptions, it can help you make informed decisions in your investment journey. In fact, once you get used to it, it won’t take you more than one minute to run the whole model for a company, getting a very quick idea about the potential to open a trade on the stock (or on its options).
Once again, remember: if you believe that a company’s growth will be higher than its implied growth rate, the current stock price may be undervalued. On the other hand, if you believe that the company’s future looks bleaker than its implied growth rate, its current share price may be overvalued. So, use this tool wisely, and keep an eye on both market trends and company-specific developments to make informed investment decisions.
Download the Template:
DOWNLOAD THE REVERSE DCF TEMPLATE HERE
Read more about how to import Options data to Excel and Google Sheets

