In the realm of trading strategies, Expected Value (EV) is a statistical measure that seeks to predict the potential profitability of a particular strategy, given certain market conditions. By understanding and applying EV, traders can optimize their decision-making process and ultimately enhance their profits. In this article, we delve into the concept of Expected Value, illustrate how it’s calculated, and outline three practical ways to incorporate it into your trading approach.
This article is part of a series of educational articles that describe some of the advanced concepts implemented in Option Samurai’s option scanner. We aggregated more information on our tutorial page.
Key Takeaways:
- Expected Value predicts a strategy’s profitability by considering market conditions like option prices, implied volatility, stock price, dividends, and more.
- Utilizing Expected Value allows traders to filter trades with a positive EV, revealing those with a statistical edge.
- Traders can create custom ratios using Expected Value to uncover trades that best align with their unique trading style and goals.
What is Expected Value
Expected value is a statistical measure that tries to predict the strategy’s value, assuming you could have executed it many times at different dates but with the same prices/distances, etc. It is calculated by summing the payout at expiration multiplied by the probability of that payout.
The expected value is derived from: Stock price, option prices, Implied volatility, time to expiration, the distance of strikes from the last price, dividends, and risk-free rate. Usually, you aim to have the highest expected value possible, as it indicates a statistical edge.
Example: Expected Value of put spread

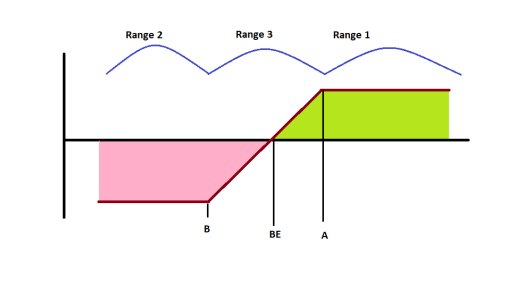
In this example, we will see how the Expected value is calculated on a bull put spread. This spread is built with a short put (strike A) and a protective long put (strike B) where both options have the same expiration and A>B.
We can divide the spread into 3 ranges:
- Maximum profit range (where the price is greater than A) – Range 1 in the example
- Maximum loss range (where the price is lower than B) – Range 2 in the example
- Between A and B the spread will show profit or loss that is linear changing depends on the stock price – Range 3 in the example
To calculate the expected value we add:
- The probability of being above A * max profit (positive)
- The probability of being below B * max loss (negative)
- For the area between A and B, we use log-normal distribution and multiply it by the payout.
The sum of the 3 components is the Expected value.
Expected Value and Monte Carlo Analysis (update):
Until now, we’ve described how you could calculate the Expected Value using the options prices and the embedded probabilities. This is how we calculate Expected Value in our options screener and details page. However, there is another way to calculate Expected Value – using Monte Carlo analysis. Monte Carlo analysis simulates many stock ‘paths’ (often tens of thousands or hundreds of thousands) and calculates the option price in each path. We then aggregate the results and average them to get the expected path. In a broad view, Monte Carlo uses possible stock paths to calculate EV, while the above method utilizes the options prices.
We use Monte Carlo analysis to calculate Expected Value (EV) in our Scenario engine (Scenario app, Knowledgebase article), and we’ve written a detailed article explaining the process: Calculating Options Expected Value using Monte Carlo Analysis.
How to use Expected value:
After explaining what is expected value we get to the most important part: How can we use it to find better trades.
1. Filter according to Expected value
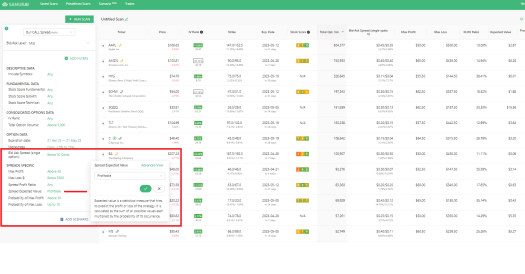
This is the most prominent and powerful way to use this value. With our option scanner, you can instantly find only the profitable trades according to the expected value, in real-time. This means that you only analyze trades where you have a statistical edge. This saves you time and, in the long run, helps your edge compound.
 You can also set the expected value filter to be more than $100 or any other value to account for commissions and unexpected scenarios and even increase your edge.
2. Find optimal trade (Sort descending)
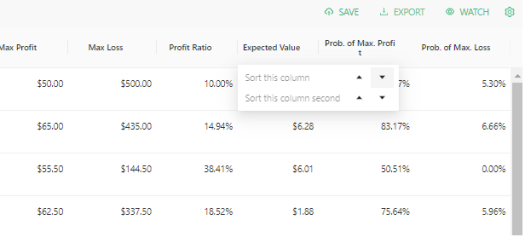
After getting your results, you can sort by expected value to compare different strikes, expiration, and tickers to find the optimal trade when taking into considerations all the different variables (profit, loss, liquidity, growth, trend, sentiment, IV, etc).

The sorting helps you manage your time more efficiently by looking at the trades with the highest edge first – meaning the optimal trade first. An Important note – The fact that the EV is positive, doesn’t mean you will necessarily make a profit, it is just indicating there is an edge in this trade in your favor.
3. Create a ratio using expected value
A more advanced way to use expected value would be to create a custom ratio unique to your trading style. The best way to do it is to export the results to excel using our export feature.

After you have all the data in excel you can start playing with it. Some ratios for example:
- Expected value / Max loss – This ratio combines EV (higher is better) and Max loss (lower is better). sorting the trades according to this ratio takes into account the worst-case scenario when you analyze a trade
- Expected value * IV rank (if credit strategy) or Expected value / IV rank (for debit strategy) – This ratio combines the EV with the Implied Volatility rank. It means that trades with high IV will get precedence if it is a credit strategy, and Low IV trades will get precedence if it is a debit strategy.
- Expected value * Growth rate – This ratio combines the EV (higher is better) with the fundamental measure of the company expected EPS growth (higher is better). This combines 2 measures from different ‘domains’ and gives precedence to higher growth
You can, of course, create more ratios that fit your style: Divide by days to expiration (EV per day), use PE (see how expensive the stock), div yield, and much more.
Conclusion
In conclusion, Expected Value is a valuable tool for traders seeking to maximize their profits by identifying strategies with a statistical edge. Incorporating EV into your trading process can help you filter and prioritize trades, save time, and develop custom ratios tailored to your trading style. By consistently applying Expected Value principles, you can enhance your edge and increase your profits over time. Don’t miss out on the wealth of advanced features available in Option Samurai, which can further empower your trading journey.
You can use the Expected value to:
- Filter trades that have positive EV and have an edge.
- Sort by EV to save time and compare trades
- Create your own custom ratios that will help you to uncover the trades that best fit you.
We have more advanced features in Samurai, Such as:
- Implied Volatility suite – Read the knowledgebase article here.
- Unique features section in the knowledgebase
- Read about the edge of using IV percentile and backtests we did
(The article was originally published on Dec 13, 2017, and updated since.)


[…] can also review the expected value article to have a more in-depth […]
Is the calculation/approach the same for an iron condor? Or do you just compute the values for one side of the iron condor (e.g., the side with the max loss), given that it is impossible for the price to end up moving in both directions at option expiration? Thanks!
The calculation is similar for Iron Condor. We take into consideration that you can only be on one side. We just multiply the max loss of each side by the probability of being in that side (Please note that IC doesn’t have to be symmetrical nor ‘in the middle’. This is why we might use different max loss and different probability for each side).
Hello,
Could you detail us the expected calculation of a Put Spread , in particular the part of the calculation where the price is between
the B and A strikes ,and show the final formula ?
Best regards ,
Philippe ,
Hey, Sure read here: https://samurai.froged.help/docs/en/21678960-expected-value
The value between is the probability * the p&l
[…] can also review the expected value article to have a more in-depth […]
I don´t understand how to calculate the P&L of Range 3 🙁
e.g: If my maximum profit is
$58 in Range A (Delta 32 Short Put ) and max Loss
$350 in Range 2 (Delta 11 Long Put),
how can i determine the P&L for Range 3 now ?
Do you have any sample calculation? Thank you
Hey Carsten,
The calculation in that part is not linear. You multiply the Profit/loss by the probability along the distribution function. Since it is not linear, I don’t have anything in Excel or some other easy-to-read format.
Did you backtest your EV?
E.g. take the calculated EVs from 100 positions (or more) each day, and then see how much these positions were actually worth on expiration.
Thanks for the question Nico!
We haven’t backtested EV, but You have to note that 100 days are not independent. Meaning they are all connected to about 3 monthly expirations or about 15 including weeklies. So we need a larger sample.
We have tested internally the probabilities of profit, and we saw that it is very connected to the trend, for example: when the trend is bullish, the calls are mostly cheap, and puts are mostly expensive. Even if it doesn’t look like it from IV point, the delta makes the difference.
Anyway, when looking at the EV, I use it to find the best option, for example, let’s say I want to buy call spread on XYZ, I will pick the expiration and the strikes using the best EV in my parameters (so the distance, width, profit ratio, etc, and all will be determined by the EV).
I also use it to find trade ideas, I sort by max EV (but filter according to stock score and technical analysis) and I start going from max EV to see if I can find new trade ideas.
Hi quickquestion, how are you calculating the probability?
Hi Chris,
We are using the option price to calculate the implied probability. I think in Wikipedia there is a section about it.