Expected Value (EV) is a statistical measure designed to help understand the value of a variable over time under uncertain conditions. This article will describe how you can apply it to options trading.
In this article, we will discuss the following:
- What is Expected Value? Why use it?
- Monte Carlo Analysis and how to use it to calculate options’ Expected Value
- Options Samurai’s Scenario Engine and Expected Value
- Example for using Options Samurai’s scenario engine
- Customizing the Monte Carlo simulation
- Summary
- Sources for further reading
Let’s begin.
What is Expected Value? Why use it?
Expected value is the predicted average value of a trade over time. It is the average of a variable set of results. This calculation aims to help us determine if a trade has an edge and to help compare different trades (or trading systems) to improve our trading results.
For example, In Samurai, we use Expected value calculation to help find optimal iron condors for the same ticker. Since Iron Condor is built from four options, there can be tens of thousands of possible combinations for each stock – we use EV to present the optimal one.
Another example is in Modern Portfolio Theory – where we use to build an efficient frontier based on the assets’ EV and standard deviations.
This article will show a third way to use the EV to find the optimal strategy for a ticker and a scenario.
What are the ways to calculate Expected Value?
As mentioned, the goal of the Expected Value is to help predict the average value of a variable set of trades. While it is a very useful metric, there are several ways to calculate it. Those different ways have benefits and disadvantages, and it’s essential to understand the assumptions behind them to understand the strengths and weaknesses of the model when using it in trading.
The first way is using the options probabilities to calculate the expected value. The price of the options implies the likelihood of them expiring in the money. We can use this information to calculate the expected value. We wrote an article about this way of calculating expected value and how to use it here: What is Expected Value and 3 ways to use it.
Another way to calculate the expected value (and this is the way we will focus on in this article) is to calculate the possible stock path using Monte Carlo simulation. Then, after we calculated the possible stock paths till expiration, we can derive the expected value of the options strategy from that.
In broad view – the first calculation uses the options prices to derive the probability of expiring ITM and, from there, calculate the EV. The second calculation uses the possible stock paths to calculate the option strategy value at expiration. See more info below.
Monte Carlo Analysis for calculating Options Expected Value
If we look at the past performance of an asset, for example, $AAPL stock, we will see the path it took in the past. Out of the infinite possibilities, the stock could have moved we see only one path for that stock. Monte Carlo is a statistical system that simulates many instances and averages the result. This way, we can see the ‘road not taken’ for the stock. You can read more about Monte Carlo here (Wikipedia).
In the $AAPL example above: We can simulate 100,000 different paths the stock could have moved. We will use the stock volatility (and drift – see more below) to randomly assign a value to rise or fall for each day until we complete a ‘new possible path.’ Once we have 100,000 possible paths, we can average them, use median, use percentiles, or any other calculations to find the ‘typical’ path the stock could move.
The Monte Carlo simulation is a kind of ‘brute force’ calculation to help us analyze many different scenarios simultaneously. In our case, after finding the stock path – we will calculate the options payout and calculate the Expected Value from there.
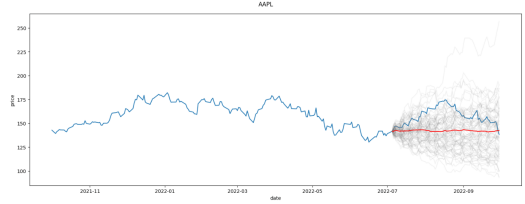
- The above picture describes the movement of $AAPL stock. The Blue line is the real behavior. The grey lines are possible paths using Monte Carlo simulation. The Red line is the average.
We can see in the above picture that the real behavior of the stock was a ‘possible’ path in the simulation. The difference is that we can create the simulation to try and project into the future and take action based on that analysis and not in hindsight.
The main idea behind this method is that the stock market has an element of randomness. But when analyzing the past, we only see one scenario. The Monte Carlo allows us to check many scenarios at once to gain a better understanding of what ‘could have happened’ and, from there, get a better projection of what can happen in the future.
The Scenario engine and Expected Value
Our new Scenario tool (article in our knowledge base) is designed to help you find the best way to trade a specific stock and a specific scenario. We use your ticker, date, and scenario inputs to check all possible combinations for every option strategy and give you the best trade for each strategy (read more in the help section).
Since there are thousands or hundreds of thousands of possible combinations for each strategy – we use Expected Value to compare them and present the optimal trades. As mentioned, we are using the Monte Carlo method to calculate the EV, and in this article, we will go more in-depth into how to do it.
Step One: Monte Carlo Simulation
We create a Monte Carlo simulation for the selected stock. We create tens-of-thousands or hundreds-of-thousands possible paths for the stock to generate the population for the calculation. The paths are built live using the stock drift and volatility (which can be adjusted) and log-normal distribution. We use this population for the following calculations.
Step Two: Picking the population for the scenario
After we have the population for the calculation, we cut the population according to the scenario. For example, if the scenario was ‘Above $150’, we will only use paths above $150 at expiration. Every path that didn’t finish above $150 will be excluded from the subsequent calculations.
Step Three: Building the options strategies
For every possible options strategy and every combination, we calculate the trade statistics – such as profit, risk, and probability of profit.
Step Four: Aggregating the results and calculating the Expected Value
After we have the results for each path in our population, we can aggregate the results and calculate the statistics. The Expected Value is the average profit from all trades in the population (after we’ve cut the paths that didn’t fit the scenario). We use this value to pick the optimal trades for each strategy, given your risk appetite (you can set it using the slider – see more in the help section).
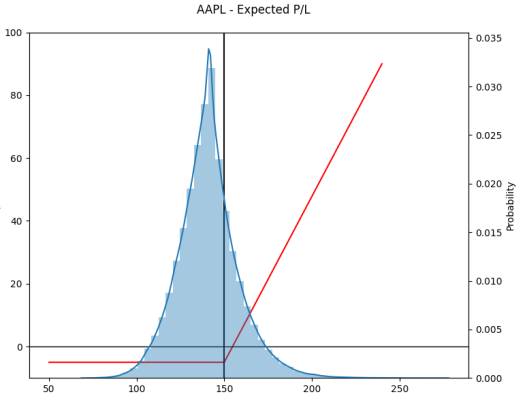
Important note: In the scenario tool, we present all the data you need to make informed decisions about the trade:
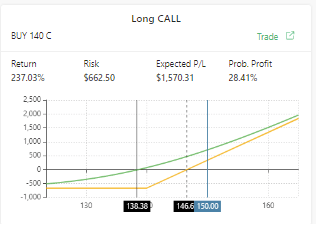
- Risk is the number of dollars you risk for this specific trade, using the current options prices.
- Expected P/L: is the Expected Value calculated as shown above. It will be different from the profit of this SPECIFIC trade and this SPECIFIC scenario as it is calculated assuming a large population of trades.
- Return is calculated using the Risk and Expected P/L.
- The probability of profit is the profitability of this trade to be profitable calculated using the B&S formula.
- The trade profit in this scenario is shown by hovering on the chart.
Scenario engine Example:
Let’s see a basic example to see how it all comes together. For example, if we take $AAPL stock (currently ~$145), and we ask for the best trade if AAPL will be above $150 by December expiration.
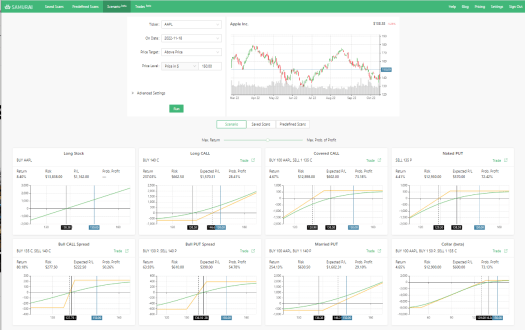
This will be the input:
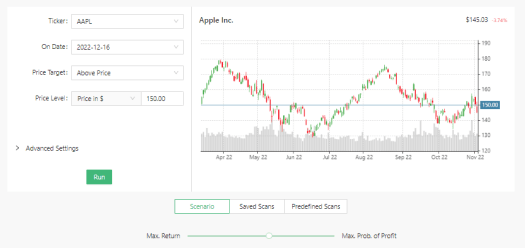
And the results:
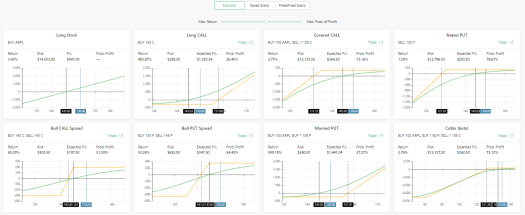
Since this is a bullish scenario, we see eight possible bullish strategies and the best trade for each (according to risk-reward tolerance). Furthermore, you can see that each strategy has an ‘Expected P/L’ field, which is the expected value of the options as calculated by the Monte Carlo simulation.
From here, we can adjust the trade or our scenario and help us find the best way to trade our stock outlook. Read more in our knowledge base article for technical instructions.
The scenario engine is very useful. Here are some examples of what we can do with it:
- How to play merger news or a public tender. You can see an example use-case we wrote in our knowledgebase.
- Find the best trade for a price target: For example, if your technical analysis or analysts give a price target, you can find the best trade to capitalize on this view.
- Find hedge trades: You can give a lower price target to an index (or any asset) and find the most cost-effective way to profit from that scenario -> This will be a way to hedge your portfolio.
- Find Volatility plays and pick them by the best expected-value calculated using Monte Carlo simulation.
- And much more.
Control the Monte Carlo Simulation with Advanced mode
As mentioned, the Monte Carlo simulation simulates tens of thousands of paths the stock ‘can have’ in the future. We then use that population for our statistics. The paths are built using a log-standard deviation move and the stock’s Volatility and Drift.
You can control those parameters for the simulation to fit your views better. The two main variables to control are Volatility and Drift. This will best be explained using an example:
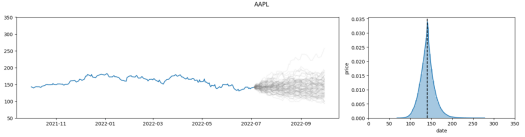
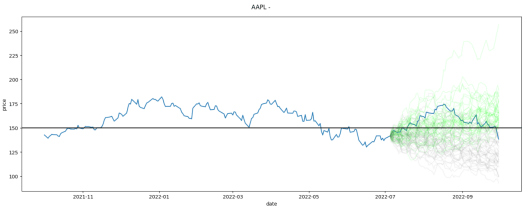
In the above picture, we see two charts. On the left, we see $AAPL stock price until July 2022, and then a Monte Carlo simulation for the next 3 months. On the right, we see a distribution chart of the final price and the frequency. We can see that the distribution of the results is around ~$145 (dashed line), and we have results from about ~$075 to about ~$275 (but very low frequency).
We will use this chart as a baseline to explain the following parameters.
Volatility
The volatility represents the magnitude of the stock price movement. The higher the volatility, the easier it will be to reach further strikes. By default, we use the stock’s historical volatility. But we can change it to Implied Volatility or any other value you believe.
To understand the impact of the volatility, let’s see how extremely high volatility affects the simulation. The following picture has the same parameters as the baseline above but with high volatility:
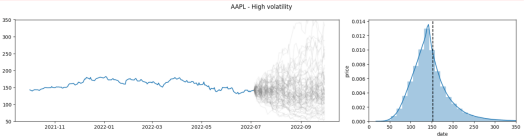
When comparing the two pictures, we can see that the simulation average didn’t change much (around ~$150), but the possible results and the probability (i.e., frequency) of reaching higher strikes are much higher. You can see that the results vary from below $50 to above $350 (the chart limit to make the pictures easier to understand).
Drift
This represents the annualized forward motion of the stock in the simulation. The higher number, the more bullish it is for the stock. Pressing the icon next to the input field will allow you to use the risk-free rate (U.S. Treasuries) or the stock’s historical drift.
Here as well, to understand the impact of the drift, let’s see how extremely high drift affects the simulation. The following picture has the same parameters as the baseline above but with high drift:
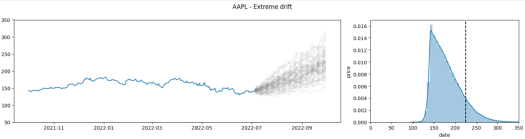
When comparing the two pictures, we can see clearly that the simulation is very ‘grouped,’ but it skews upwards. We can see that the average (the dashed line) increased to about ~$230 from about ~$150. However, the results are still ‘grouped’ and have less probability of being very far from the average, especially when compared to higher volatility.
Summary
Expected value is a statistical measure designed to predict the average value of a trade over time. It is a single number that describes the average results of variable trades. The EV doesn’t predict the exact profit or loss of a given trade, but it helps find an edge and helps improve our trading. Additionally – it helps us compare different trades in the same strategy.
In the Scenario engine, we use a Monte Carlo simulation to calculate the Expected Value. Monte Carlo simulation creates hundreds of thousands of possible paths for the stock path (based on volatility and drift), and we use those paths to create a population to calculate the statistics needed. The benefit of this calculation is that we can ‘see the road not taken’ for the stock and compare many ‘what-if’ scenarios for the stock and use them in our calculations.
We use the Expected Value in the scenario engine to compare different trades for each strategy and suggest the best trade according to your risk appetite. This helps you quickly find the optimal option trade for your market outlook.
Read more:
- Scenario engine
- Usecase scenario engine – Find trades for a merger.
- Video about using the scenario engine
- Expected value and options: What is Expected Value and 3 ways to use it.

