Understanding what is a good implied volatility for options is crucial in options trading. This article will delve into the importance of determining a suitable implied volatility range. We’ll address key questions like “Is 30% IV high?” and explore what constitutes a successful IV rate.
Key takeaways
- While a commonly cited “good” IV range is 20% to 25%, the ideal IV can vary greatly depending on the specific asset, strategy, and risk tolerance level.
- Implied volatility (IV) plays a fundamental role in options trading, affecting pricing and the potential for profit. Selecting the right IV is crucial for trading success.
- High IV can carry both potential rewards and risks. It is important for traders to understand their individual trading goals and market conditions when deciding on what constitutes an advantageous IV.
What is Implied Volatility (IV)?
Understanding what is a good implied volatility for options is essential for a successful trading strategy. IV, essentially an estimate of a stock’s future volatility, plays a significant role in options pricing. It is calculated using an option pricing model, like the Black-Scholes Model, which considers various factors, including the stock price, strike price, time until expiration, and risk-free interest rates.
So, what is a good implied volatility for options? The answer can vary, as there is no such thing as a universally “good” IV rate. This aspect requires an analysis that goes beyond the mere absolute value of option IV.
Determining what is considered high implied volatility for a given option and a good IV success rate is crucial for making informed trading decisions, normally making use of an options screener. This knowledge enables traders to gauge potential risks and rewards effectively.
What is a Good Implied Volatility Range?
Determining what is a good implied volatility for options can be challenging, as there isn’t a universal rule to define the threshold of low or high implied volatility (IV). This varies significantly across different assets and market conditions.
The question, “What is a good implied volatility range?” doesn’t have a definitive answer. However, a general rule often applied in options trading is buying options when IV is perceived as low and selling options when IV is deemed high. But “low” and “high” are relative terms and depend on the historical IV of the asset.
Following a highly anticipated event for a traded company, such as its quarterly earnings report, we often see a strong decline in IV (i.e., an IV Crush). While there’s no rule to define how low IV can go after these events, the general consensus on the market is that implied volatility will strongly decline in these cases.
So, while you may wonder, “Is 30% IV high?” or “What is a good IV success rate?” it’s important to remember these factors are largely dependent on past data and the asset in question. Therefore, what is a good implied volatility for options? As we’ll see, what is considered high implied volatility for options in one scenario may not hold true in another.
What is a Good Implied Volatility Percentage for Options?
When trading options, a common query is, “What is a good implied volatility for options?” The answer to this question depends on several factors. Implied Volatility (IV) is a measure of the market’s expectation of a stock’s price movement, and it plays a crucial role in options pricing. A high or low IV can indicate if an option is expensive or cheap.
The ideal IV percentage varies for different types of options and is influenced by market conditions. For instance, during extreme events like the COVID-19 crash, the whole market IV behavior was significantly affected. Therefore, understanding what is a good implied volatility for options requires an analysis of the market environment.
Option Samurai’s IV backtesting provided valuable insights into the relationship between IV percentile and future IV changes. The results show that IV tends to decrease after a high IV percentile and increase after a low IV percentile. This mean-reverting nature of IV can be utilized to predict future IV movements.
![]()
So, how much IV is good for options? When the IV rank (percentile) is high, say above 90, it suggests that the options are expensive, and strategies that profit from a decrease in IV, such as selling options, might be beneficial. Conversely, a low IV rank might indicate an impending rise in volatility, making buying options a potentially profitable strategy.
Is 30% IV high? Not necessarily. If you refer to the IV rank, then 30% is not a high value (in fact, you may even easily consider it as low). If you look at the absolute IV value for an option, an IV equal to 30 may be either low or high. In fact, later in this article, we’ll share two examples to demonstrate this notion.
Therefore, a good IV success rate depends on understanding the IV percentile and adapting your strategies based on market conditions. Utilizing tools like Option Samurai’s IV Rank can help traders find trades with high or low IV percentile, enhancing their trading edge (notice that we call IV percentile IV rank).
![]()
Understanding High and Low IV Through Two Examples
In the following section, we’ll be delving into two distinct examples. Despite having the same Implied Volatility (IV), these examples showcase varying IV ranks, bringing forth the importance of context in determining what ‘good’ IV entails. These examples will illuminate how ‘good’ IV can have different implications under different scenarios, further emphasizing the importance of understanding the nuances of IV rank in the field of options trading.
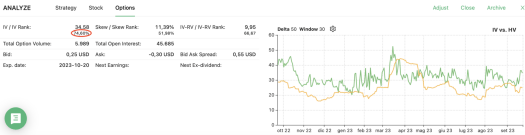
Specifically, we will look into Qualcomm Inc. (QCOM) and ProShares Short VIX Short-Term Futures ETF (SVXY).
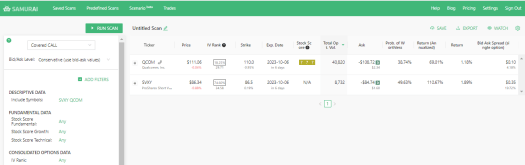
As you see in the image above, we’re purposely taking two options with similar IVs (close to 30) and very different IV ranks (i.e., lower than 30% for QCOM and higher than 70% for SVXY). This situation will lead us to evaluate two different options trading strategies.
How Much IV Is Good for Options?
Determining what is a good implied volatility for options is not a straightforward task due to the lack of a universal benchmark for low or high implied volatility (IV). The ideal IV range varies across different assets and market conditions, making it challenging to pinpoint a specific ‘good’ implied volatility percentage for options.
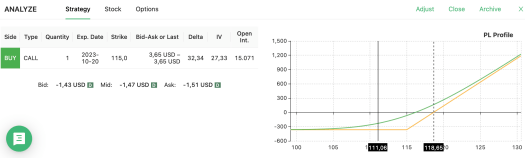
For example, let’s consider Qualcomm Inc. (QCOM) 10/20/2023 Call options at a $115 strike price. We can examine a strategy as indicated in the image below, with a solid black line standing on the current stock price and a dotted vertical line indicating the breakeven price of the strategy. We can see that because the IV is relatively low, the breakeven-point is closer to the current price compared with if the IV was higher:
If we look at a screenshot from Option Samurai, we can see that the IV rank is equal to 27.38%. This means that during the past year, the asset had a lower IV on only 27.38% of days.
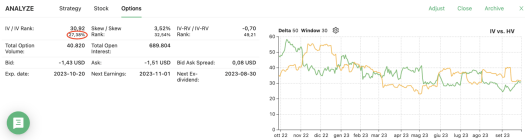
However, don’t rush to conclusions; this is merely an example. An IV rank of 27.38% doesn’t automatically signify a good or bad opportunity. It’s crucial to remember that the IV rank alone is not sufficient to evaluate an investment. It should be used in conjunction with other metrics and indicators (in fact, you may want to read our piece about IV indicators).
You may wonder, “Is 30% IV high?” or “What is a good implied volatility for options?”. These are valid questions, but the answers are largely dependent on the historical IV of the specific asset and the overall market volatility. Simply put, the concept of ‘high’ or ‘low’ is relative when it comes to IV.
In conclusion, while there isn’t a definitive answer to “What is a good IV success rate?” a good rule of thumb in options trading is to compare the current IV with the asset’s historical volatility. This approach can provide a better context and help you make more informed trading decisions.
Is 30% IV High?
Understanding what is a good implied volatility for options can be complex due to the lack of a universal rule defining a threshold for low or high IV. This varies across different assets and market conditions.
For instance, consider a screenshot from Option Samurai where we simulate a bear put spread on ProShares Short VIX Short-Term Futures ETF (SVXY) options at $80/$81 strike prices. Here we can examine a sell put spread strategy (once again, the website’s view is very helpful in giving us the P&L profile of the strategy, with an indication of the current and breakeven prices for the strategy):
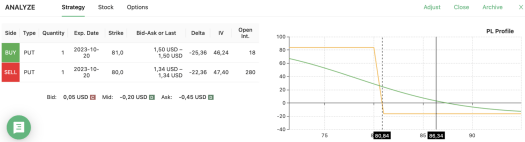
The platform indicates a relatively high IV rank of 74.60%. This implies that, over the past year, this asset had a lower IV on 74.60% of the days. Because the IV is high, we can consider a credit strategy, where the profit is higher and the break-even point is further, compared to if the IV was lower.
Hence, at this IV rank level, one may imply that the option premiums are too high, and a potential decrease in IV may favor the seller. Therefore, the question “What is a good implied volatility for options?” is often answered by considering the IV percentile rather than a specific percentage.
However, this is just an example. An IV rank of 74.60% doesn’t necessarily mean it’s a good or bad opportunity. As emphasized in the previous section, the IV rank alone isn’t sufficient to evaluate an investment. Questions like “Is 30% IV high?” or “What is considered high implied volatility for options?” are subjective to the historical IV of the specific asset. Thus, understanding what is a good implied volatility comes down to comparing the current IV with the asset’s historical volatility.
What is a Good IV Success Rate?
Before answering the question above, we should be familiar with the concept of “success” in the context of options trading. When evaluating the success rate of implied volatility (IV) in options trading, it’s crucial to recognize that a high IV signifies a higher implied statistical probability of reaching a strike price. In essence, it suggests that options with strikes further from the At-The-Money (ATM) level are more likely to be reached.
However, there is a nuanced distinction to be made. While a high IV implies a greater chance of success according to statistical models, the implied probability of profit might not always align with the real probability of profit. This is where traders can find opportunities to profit by assessing the discrepancy between these probabilities.
In practical terms, when IV is elevated, the probability of profit when selling a distant option is lower compared to a scenario with the same underlying asset but a lower IV. Nevertheless, the trade-off is that selling high IV options provides higher premiums. If a trader’s analysis leads them to believe that the asset will not breach the distant strike price, they stand to make more money despite the lower implied probability of profit. This is one of the compelling reasons why it is often recommended to sell options when IV is high.
Conversely, when IV is low, the implied probability of profit is higher, but the premiums for options are reduced, which may not align with a trader’s market outlook. Thus, the choice between buying or selling options is influenced by a trader’s assessment of both implied and real probabilities, along with their market expectations.
The question, “What is a good implied volatility for options?” is often accompanied by another query: “What is a good IV success rate?” The success rate in options trading is critical and can be significantly influenced by the implied volatility (IV) of the options.
The IV success rate essentially measures how often the IV accurately predicts a stock’s price movement. A high success rate indicates that the market’s expectations, as reflected in the IV, frequently align with actual price changes.
However, identifying what constitutes a favorable implied volatility (IV) level for options is not a straightforward task. It hinges on a multitude of factors, notably including the historical volatility of the underlying asset and the current state of the market. Nevertheless, taking a more decisive stance, one can refer to the concept of IV rank. When assessing the IV rank, traders often find it advantageous to consider options with a rank below 30% as indicative of low IV, while options with a rank above 70% are typically considered to be high IV. This rule of thumb has proven to be a reliable guideline in the realm of option trading, offering traders a more specific framework for evaluating IV suitability.
Improving your IV success rate involves understanding these variables and adjusting your trading strategies accordingly. This might mean choosing options with a higher or lower IV based on your expectations of future price movements. By doing so, you can better align your expectations with the market, potentially improving your IV success rate and overall profitability in options trading.
Conclusion
In conclusion, understanding the role of Implied Volatility (IV) in options trading is paramount. We’ve managed to answer the question “What is a good implied volatility for options?” by highlighting the factors that influence it. It’s essential to remember that the ideal IV is relative and can vary depending on various market conditions.


Glad you mentioned QCOM, I sold a couple covered calls on it this year at a time when the IV was a little lower. But did well nonetheless. Great post, thanks for sharing!
Thanks!