With the addition of the Excel integration to the Samurai platform, we can now create advanced tools in Excel and increase our edge while trading. For example, we have shown in our Blog and Video how you could use our EPS-PE template to get your own estimate of a stock’s value.
This article will show you how to use this Excel template on a more complicated example so you can do it yourself.
The importance of getting your own estimation of a company value is high – since it will allow you to be self-depended and find opportunities in the market. Once you know what you think a company is worth – you can trade it, either long or short (try our scenario engine to find advanced optimal options trades). The Excel template updates automatically with updated values every time you open the sheet, so using it becomes much more manageable.
Before we start
- Download the template and name it with the stock and date of the analysis (so you can update the file in the future)
- Read in our blog about the Stock Valuation Model (+Automatic excel import of stock data)
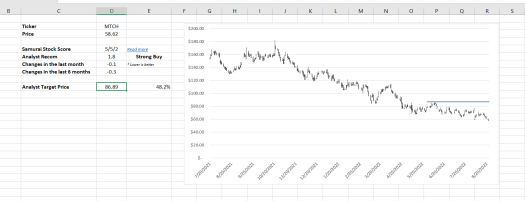
MTCH Stock
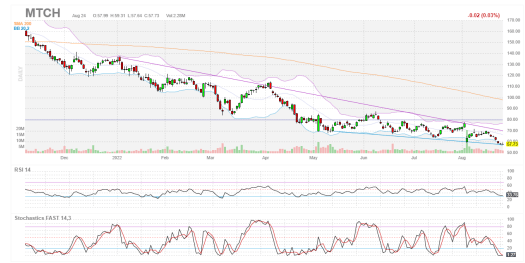
In this example, we will analyze Match Group, Inc. It provides dating products worldwide. The company’s portfolio of brands includes Tinder, Match, Meetic, OkCupid, Hinge, Pairs, PlentyOfFish, and more.
Recently the company fired its Tinder CEO and posted slowed growth. Since I believe the company will continue to be profitable, and I think this space will grow (and this company is the leading company in this space). And the current price is around the 2019 levels – I think this might be an interesting time to analyze it and maybe trade it.
Step one: Import data
This step is easy. We enter ‘MTCH’ into the symbol cell and make sure the orange cells are correct. The rest should be updated automatically.
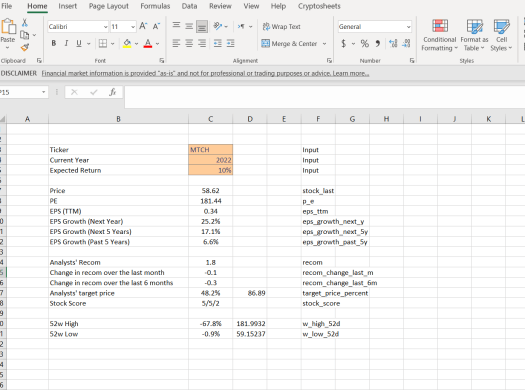
Step Two: Filling the EPS-PE model
For stable companies, there is a high chance the model will be updated automatically with very few changes needed. However, in our case, MTCH showed a considerable decrease in EPS this year. So if we estimate based on the most recent EPS, we will get a low target price. However, I believe the EPS will be higher in the future since the company already showed us it could post high profits on even lower sales figures.
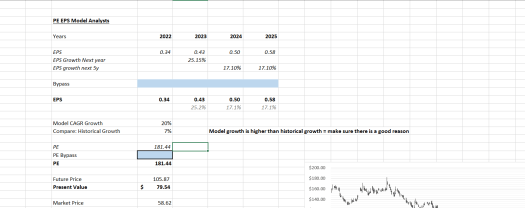
The model before changes:
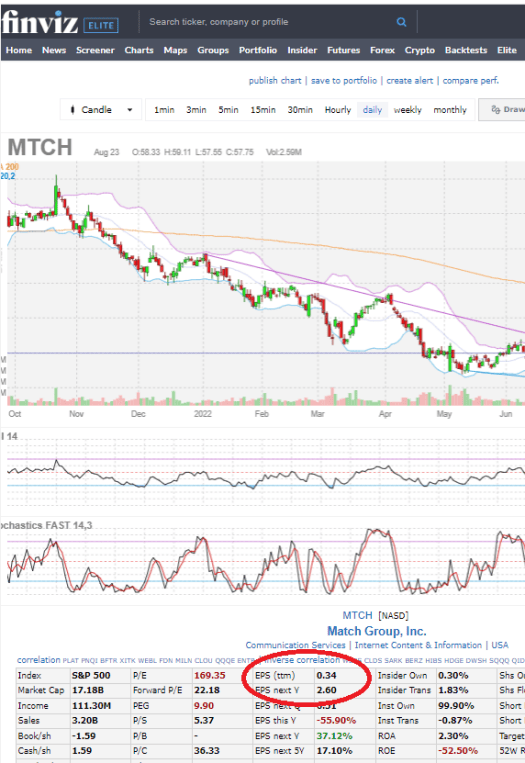
To change the EPS to something I feel more realistic, I usually start by reading the management estimate in the financial reports or analyst estimates. You can find the analyst estimates in financial portals like Finviz or Yahoo finance.
Example in Finviz:
Example in Yahoo Finance:
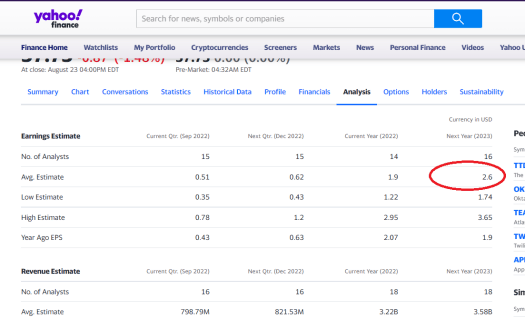
Usually, those estimates are excellent to start with. Therefore, I will input the $2.6 EPS in the blue cell for 2023. The growth will be 17.1% which is what the analysts expect. I will use their estimates as it’s lower than the company did in the past.
The model after changes will look like that:

I will also adjust the PE ratio from the current 180+ to something I feel is more conservative for a growing company – let’s say 25. In current market conditions, it seems good.
The final model looks like this:
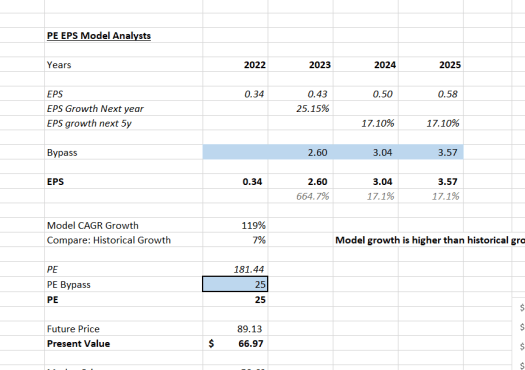
We can see that the ‘fair price’ under those assumptions will be about 14.2% higher. This is usually not enough as we don’t have a margin of safety if our assumptions are wrong. But this is not the end – read more below for considerations in initiating a trade.
Under the model price, we can see some scenarios. The most interesting one is the analyst target price – we can see 48% above the current price. This is a positive sign and might indicate we have an upside.
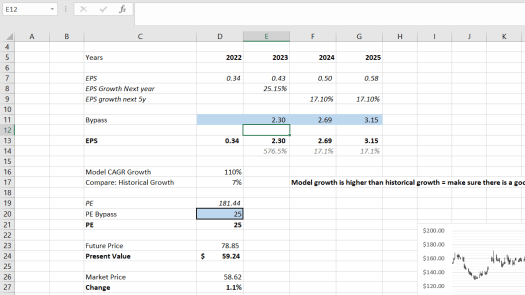
Step Three: Adjusting the model to get the market price
In part 2, we entered our assumptions, generated our estimate, and compared that to the market price. In this step, we will assume the market price is correct and try to see how we change our assumptions to arrive at that market price. We will then see if the assumptions make sense to us.
The assumptions we will change are:
- The PE ratio
- The EPS
- The growth rate
In this case, I will not change the PE ratio as it is reasonable (I believe). So I will focus on changing the EPS and the growth rate. In this step, I will slowly increase/decrease the values to see the magnitude it changes the final result and see if it makes sense.
- When changing the EPS, I see that if the EPS will be 2.3 instead of the 2.6 I projected, the value is fair.
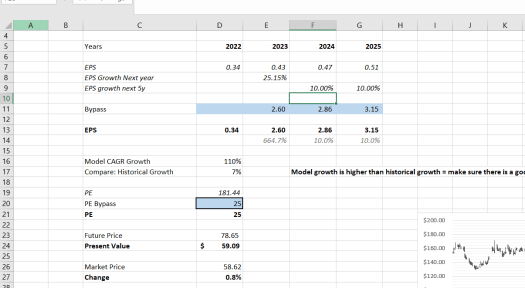
- If I change the growth rate, I see that a growth rate of 10% will make the company price reasonable.
- Of course, a combination of both will work as well.
When I compare the assumptions to what I think will happen in the market. I believe the growth rate will be higher than 17% once the company fixes its cost structure. So I don’t think a 10% growth rate is that risky (Assumption #2). However, the company EPS can certainly be 2.3 instead of 2.6. It’s a 12% miss in a year when the macro environment is unclear. So it’s a possible scenario.
These scenarios help me read the news about the company and analyze them. For example, if I read something that could hurt the income once, I can assume it’s already priced. But If the growth rate slows, it could be a terrible sign for the company’s valuation.
Step Four: Sensitivity Analysis
In this step, we can see how different growth rates and PE ratios affect the company’s price. This is a very powerful tool to understand the ‘sweet spots’ of the company. However, we will not cover it in this article and will have a different piece for it.
Step Five: Analysts’ recommendation
If available and the company is covered by analysts, I like to check the target price and the trend of the analyst’s adjustments. This adds confidence to my analysis (usually, I want to be more conservative).
Considerations in opening a trade
In this example, because I’m bullish on the company and I think the growth rate will surprise the analyst (after the company adjusts its cost structure), I will look for an entry signal. Usually, I will integrate it with a technical indicator (oversold) or a clear technical point (support or a place for stop loss). In this article, I want to cover some considerations for different strategies, regardless of other trading styles.
Selling puts/put spreads – These are credit strategies, and I like to open them under the current market price. Here I will try to open under strike 50 or 45, which are about 25-40% away from my ‘fair’ price according to the model. I would rather sell puts (if the portfolio can support that) because it is easier to manage.
Long calls / Call spreads – These are debit strategies, and I would rather buy calls over spreads as the profit is unlimited. However, I want a very large upside when buying calls, so I would rather see the markets on my side as well. This means – bullish or oversold (as of writing this article – markets are bearish). If they are not – I would rather sell puts/put spreads.
Read more:
- Go to Options screener
- Help article about the Excel + Google Sheets plugin
- Video of using the excel options integration.
- Blog about Excel and Google Sheets integration.

