Option Samurai’s option scanner is designed to help you find the best options trades in the market. To do that, we compile many data points from different sources to help you utilize different edges in the market. This makes your trades more robust because you can find various trades that work in different market regimes. We often backtest specific data points and trades to validate what data we add and help you maximize your advantage. We have a series about the Implied Volatility edge and backtest, and you can read the first part here.
This will be the first of a series of backtests to test different technical indicators to help you get the maximum out of our technical analysis engine.
In this part, we will use our table backtest framework and the RSI indicator.
What is the RSI indicator?
The Relative Strength Index is one of the most common technical indicators. It is designed to compare the current strength of the asset compared to its past value. Read more about it in our Knowledgebase. We will use it as a contrarian indicator for mean-reverting trades, meaning that when it is extremely low, we will go long, and when it is extremely high, we will go short.
What is the table backtest framework?
The table backtest framework is a backtesting framework we invented that tests the average change in an asset after an event. The table backtest is designed to show variations of this event and their effect on the change at a glance. Here is an example:
The rows on the right show us the different thresholds for the events: Above 90, Above 80, Above 70, etc.
The columns show us what was the average change X days later: 5 days (1 week), 10 days (2 weeks), 15 days (3 weeks), and 20 days (about a month).
The cells themselves show us the average change of the asset OVER the regular shift. This means that if we see 1%, in that scenario, the asset moves 1% MORE than usual on average.
For example, in this table, we see that the SPY moved on average 2.67% MORE than usual after the RSI breached 20. Also, after the RSI crossed 80, it changed on average -4.47% LESS than usual in 20 days.
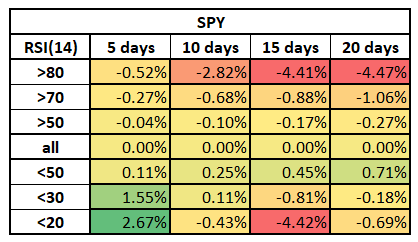
The power of this backtest is that it shows us different thresholds and events and how they affect the change of what we are testing in one glance.
Before we check the backtest results – it is important to remember that technical analysis is trying to understand the supply and demand of assets VIA price action, indicators, etc. This is why it is essential to understand the market mechanic. For example, if we are in a bull market, assets will behave a certain way, and if we are in a panic – they will behave differently. We will dive more into it in the following analysis.
RSI on indexes
[Update for 2022 and the recent bear market]
The following tables so the change of the underlying ETF after the 14-days-RSI reached the threshold on the left column. The data is from 2016 until June 2022, including the COVID crush, Covid rush, and the recent bear market:
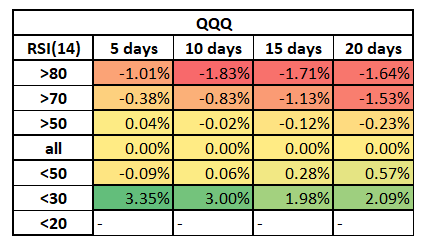
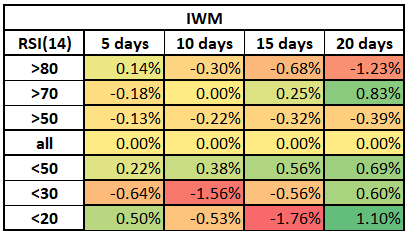
If you remember the IV backtest we ran, you see that the results here are not ‘clear cut’ as they were in the IV case. However, we can see essential and clear insights from these backtests:
- Mean Reverting – We can see that the indexes display a mean-reverting behavior – the more extreme the move to one side, the more likely it will move to the other direction. However, we can see that QQQ displays a more consistent behavior.
- Slow-moving – The RSI14 indicator is relatively slow compared to other mean reverting indicators. This means that are fewer extreme readings, but if the RSI reaches very bearish levels, it is usually a bearish sign over the longer term (3-4 weeks) as there is a lot of money exiting the market.
Here is how the table changed when compared to the past (mainly bull market):
Before describing more insights, I want to show the backtest results if we exclude 2020. The following results are from 2015 until Dec 2019 – Without 2020:
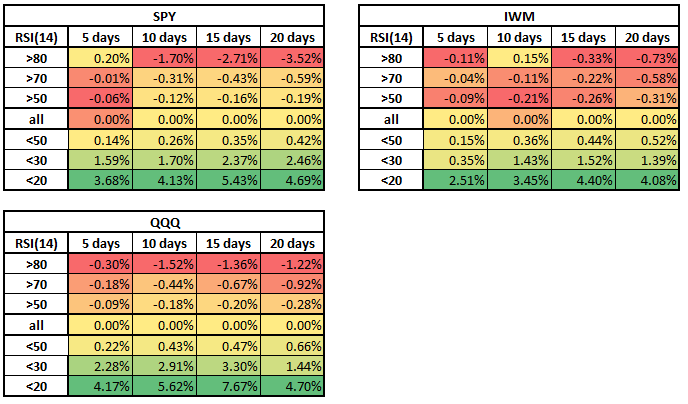
Looking at the old backtests, we can see that RSI14 was much better at signaling the revision points in the past. Especially when looking at small stocks (IWM). However, the extreme cases of the COVID crush and the money-printing and risk-taking that followed changed the mechanics of the market, and the RSI 14 became less accurate (but still has value).
What we can do now:
- When using RSI 14, we need to integrate with other indicators (such as fundamental, sentiment, or others)
- Use different time intervals for RSI.
- Use a different mean reverting indicator.
If you believe that the 2020-2021 events were extreme ‘outliers years,’ you can continue to follow the RSI14 as a mean-reverting indicator. It is a widely common and acceptable indicator, so (I believe) it could be vital again in the future.
How to use it in trading
Enter new positions – You can use the RSI indicator (and technical analysis) to enter new positions (with supporting signals). For example, if you are bullish, you can enter trades where RSI is below 20/30.
Delay entering new positions – if RSI is high (above 70), it is usually better to wait and not enter a new position.
Find trades – You can use the RSI filter to find trades to invest in. For example, if you are bullish, you can set the threshold to below 20 or 30 and delay a day or two to see if it continues lower. You can also use the Samurai’s Monitoring service, and we will notify you when there’s a new trade.
Exit trades – You can use Samurai’s monitoring feature to notify you when a stock you follow reaches over-bought/over-sold so you can add a trailing stop loss or exit your position.
If you are bearish, you can set it to 80 and time delay to ensure you have a higher probability of reverting.
We have a predefined scan you can use (Sell OTM puts with a high probability of profit on stocks that are oversold), and we also sent a few trades from it in our Stocktwits account.
Summary
RSI is a technical indicator that can be used to enter mean-revision trades when it passes extreme thresholds. However, we saw that it is essential to have a view of the market before using it, as market mechanics affect how it behaves.
When RSI is below 20, it is considered a bullish signal; when RSI is above 80, it is regarded as a bearish signal. We can change the threshold to 30 and 70 if we want to be more aggressive and have confirming signals from other indicators.
In the coming articles, we will explore the technical indicators more in-depth, using different assets (such as commodities) and more trading frameworks.
Read more:
- A webinar we presented about how to trade over-extended stocks.
- Technical analysis engine in our Knowledgebase
- Sell OTM puts on stocks that are oversold (in Option Samurai)
- More about the RSI indicator in our Knowledgebase
- The research we do into the Implied Volatility of options.

