What is Stock Valuation?
Stock valuation is the process of estimating the intrinsic value of a stock.
The stock valuation model is a simple model that helps you determine a company’s intrinsic value. The intrinsic value is the price at which the investor would be indifferent to selling the stock or holding it.
The intrinsic value can differ from the market value, leading to trade ideas.
All stock models use assumptions and estimates and range from simplistic to complicated. The general conviction is that the short-term market price can differ from the intrinsic value, but over the long run, they will converge.
Usually, the market is efficient, so you shouldn’t expect a high divergence between the valuation model and the market price. However, suppose you have other assumptions from the market; in that case, there might be a divergence between intrinsic value and the market value. For example, if you think a company will grow faster than the market estimates, it might be traded below its intrinsic value. Furthermore, periods of high volatility allow you to find more opportunities.
In these cases, stock valuation models can be very beneficial as they can provide you with an independent view of the stock value and trade it against the market price.
The stock valuation model we’ve built (provided below) imports the data automatically, allowing you to start quickly from a baseline and use the model more frequently.
What are the ways to estimate a stock’s worth
There are many different models commonly used to estimate a stock’s worth. All models have different advantages and disadvantages and require different estimates and assumptions. Ultimately it depends on the investor to choose the suitable valuation model for them. Here are some of them:
DCF Model
The Discount Cash Flow Model is probably the most common valuation model. The main idea is that the company is a financial asset and thus worth the aggregated cash flow it will create from operating through its lifetime.
Another Core idea is that a $ now is worth more than a $ in the future. So we discount the future cash flow the company creates to account for that. Typically analysts use WACC (Weighted Average Cost of Capital) as the discount rate.
The main benefit of this model is that it is widespread and can be tailored to different companies and different use-cases.
The main disadvantage is that this model is usually pretty complicated and requires the investors to make assumptions on the growth rate, profit, Capex, WACC, tax rate, and more.
Relative Value
Relative valuation models are probably the easiest to build and are commonly used in news articles/segments. The main idea is to compare a company to its peers to learn about its relative value and results. Usually, the model will compare ratios such as PE, PS, Ebidta/EV (Enterprise value), ROE (Return on Assets), Debt/Equity, and more. So, for example, you can compare Visa to Mastercard or Discover ($V, $MA, $DFS), Coca-Cola to Pepsi ($KO, $PEP), Tesla and Toyota and Ford ($TSLA, $TM, $F), and so on.
If you look in-depth at the examples above, you can see the problem of this model: while it is quick and easy to do, not all companies are the same. So, for example, Comparing $TSLA to other auto manufacturers might be misleading, as they have other lines of business and different levers in the business. Another problem is sometimes more subtle – When you see a difference in ratios, you’ll need to decide if the difference is reasonable considering the business is a bit different or if it will come together.
EPS – PE Model
The EPS-PE model is similar to the DCF model described above but is simpler and faster to create (and thus can be less accurate). The model uses two inputs:
- Earnings per share (EPS) – How much money each share makes in one year. You can find EPS by looking at a company’s income statement or balance sheet, which lists net earnings for every quarter over time.
- Price/earnings ratio (P/E) – This tells you how many times investors are paying for those earnings with their hard-earned cash; basically, it’s what they’re willing to pay for each dollar of EPS.
By multiplying these values, we will get the future share price. After that, we will use a similar discounting method to DCF to get the current fair price and compare it to the market price.
The EPS-PE Model
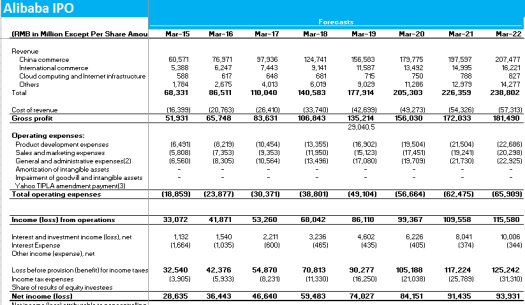
As mentioned above, there are many ways to estimate a company’s intrinsic value. We’ve built an EPS-PE Model that leverages Option Samurai’s Excel plugin to import data to the sheet automatically.
You estimate the company EPS in three years (by inserting a growth rate) and then estimate the future PE ratio. After that, we discount it by a fixed number (user-defined), and you can compare it to the market price.
Video Using the EPS-PE Model
Check out this video, taken from our Webinar, that shows how to use this model to analyze Meta ($FB)
You can download the model here.
How to use the model
This model aims to help you quickly assess the company’s intrinsic value. The idea is that you will be able to generate your own opinion of the stock and compare it to the market price. This will help you generate profits over the long term and have a unique edge.
There are two ways to use this model:
- Calculate intrinsic value: You enter your assumptions and see what is the company value under those assumptions. We have a sensitivity analysis to see how different assumptions affect the value.
- Use market Value: You use the market price as a ‘guiding light’ to the company’s ‘fair value’ and see what assumptions need to happen to achieve that price.
Calculate Intrinsic Value
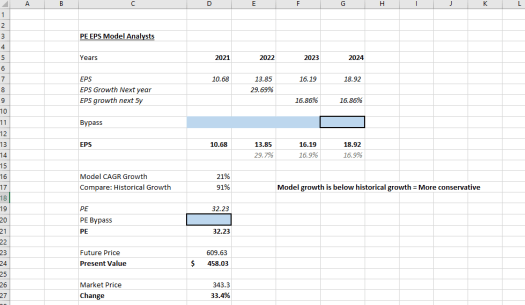
We will insert our assumptions about stock growth and future PE in the first use case and see the intrinsic value.
- We will fill the blue row (row #11) in the EPS-PE tab, specifically cell G11.
- We can check in rows 16-17 if we accept the model growth rate and projected EPS (and compare it to past growth)
- Then, in Row 20, we will add the expected PE ratio (and compare it to the current PE ratio).
After that, we can see the fair intrinsic value of the company and the value under various common assumptions.
We can also check the sensitivity analysis tab to see how the intrinsic value changes under different assumptions:
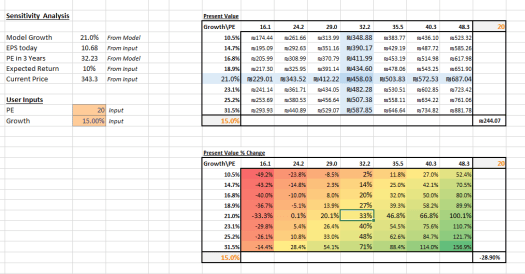
The table shows the intrinsic value (upper table) and distance from the current price (lower table). The columns are 10%, 25%, and 50% distance from our input PE ratio.
The rows are 50%, 30%, 20%, and 10% from the growth rate in our model.
This gives us 56 models to see how sensitive our model is to our assumptions. We want the model to show a clear indication (over or under-value) for most scenarios to gain added confidence in our premises.
Use Market Value
We’ve added our assumptions in the above use case and compared the fair price to the market price.
In this use case, we will try to hit the market price (with trial and error) to get as close to it with the parameters. Then we will ask ourselves if the assumptions implied by the current price are reasonable. This is a good exercise for the sanity check of our model.
First, we will start with the PE in row 20. First, we need to pick a suitable and fair PE for the company. We can do that by checking the historical ratios or seeing what the ratios are for the company’s peers.
Then we will try to adjust the growth rate until we get to the market price (several percent changes don’t matter).
We will have the market ‘implied’ growth rate and PE when we finish these two steps. Then, we need to ask ourselves if these numbers look reasonable. Again, we can use the sensitivity analysis tab to understand better how changes in those assumptions affect the values.
These two use cases take minutes to fill using our plugin once you understand how it works and get some experience. This gives you the ability to form your own idea about a company’s fair value and make trades accordingly. I use it often after earnings or significant events.
Conclusion
Stock valuation models exist to help us understand a company’s intrinsic value. That value can be different from the market value and lead to trade ideas. Therefore, it is essential to form your opinion of a company’s intrinsic value to maintain an edge in the market and perform consistently. In this article, we’ve covered several methods of evaluating a company, and we’ve added an Excel template to help you do it easily on your own. Download the excel template, install the Option Samruai plugin and try it for yourself.
Read More
- Download the model
- About the Excel and Google Sheet integration.
- Option Data in Excel
- How to import Options data to Google Sheet

