After an earning event, stocks can experience a sudden price change depending on the way the market interprets the company’s performance. This can be an opportunity for traders to capitalize on this volatility using options trading strategies. In this article, we offer a backtested strategy to help traders identify potential trading opportunities following a price shock. We’ll use Google Colab, a popular online platform for data analysis and machine learning, to backtest our strategy and provide key takeaways from our findings. By the end of this short article, you’ll also be able to perform your own analysis and spot potential trades using our predefined scans by using our backtesting file (link at the end of the article).
Key takeaways
- Stocks that experience a price shock (such as a 10% increase or decrease) usually don’t return to their pre-shock level after a given number of days.
- We have backtested this case and our analysis confirms that, on average, stocks fail to return to their pre-shock level in the short term.
- We have two predefined scans that let you spot potential trading opportunities following a positive or negative price shock.
Trading Earnings Events Price Shocks – The Hypothesis We Want to Test
Right after an earnings report is out, a stock can experience a significant price shock. This sudden change can be positive or negative, depending on whether the results surpassed expectations or fell short. This behavior is logical as new information is now public, so the market re-evaluates the company.
We want to investigate if a stock, after experiencing such a shock, tends to revert to its pre-shock level after a certain number of days. After all, if we managed to find a sort of empirical rule, we’d be able to build options trading strategies.
Our direct experience as traders suggests that this reversion is particularly likely when the price shock is not backed by a change in fundamentals. For instance, if a company reports exceptionally high earnings, it’s logical for the stock price to spike. However, if the price increase is due to mere speculation and not supported by solid financial data, the likelihood of the stock returning to its original price level increases.
We believe that these price shocks, especially those justified by strong or weak earnings reports, tend to have more lasting impacts than those driven by short-term speculation. This hypothesis is based on the idea that a shift in a company’s fundamentals often affects its stock price for a longer duration than temporary market sentiment.
Before getting to the backtest, let’s talk about how you could hypothetically trade these situations using options. One approach would be to sell a naked put or a naked call. As a reminder, consider that this strategy requires selling an option without owning the underlying stock. It can be profitable if the stock price moves in your direction, but it also carries a high risk (with potentially unlimited losses) if the price moves against your prediction.
For those who prefer a less risky approach, credit spreads might be a better choice. In a credit spread, you sell one option and buy another, limiting your potential loss. This strategy can be beneficial if you believe that a stock will remain near its current price until the options expire.
Therefore, understanding how stocks behave after price shocks, particularly those caused by earnings reports, can provide valuable insights for options trading. If you choose the right strategy, you can potentially profit from these market movements.
The Backtesting Result
We’ve conducted a comprehensive backtest to analyze the behavior of five popular big tech stocks: AAPL, MSFT, NVDA, NFLX, and META. We specifically focused on the price performance following a positive shock of at least +10% and a negative shock of at least -10%.
Positive Shocks
Our analysis spanned over 10 business days (equivalent to 2 weeks) post-shock for the last 5 years. The results were interesting:
- AAPL failed to revert to its pre-shock level 2 out of 3 times, i.e. 66.67% of the times.
- MSFT experienced a daily move higher than 10% only once, and it did revert to its pre-shock price.
- NVDA showed an impressive 77.78% event rate (7 out of 9 events) to revert to its pre-shock level.
- NFLX and META both failed to revert to their pre-shock levels 5 out of 6 times, representing an 83.33% rate.
From a graphical point of view, here is what our backtesting exercise will give you as an output:
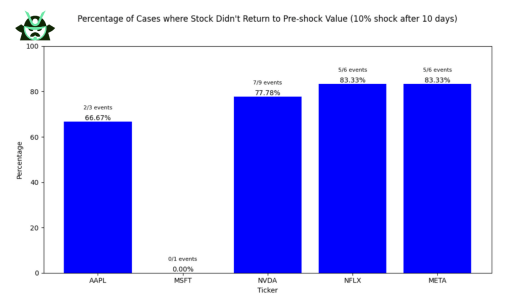
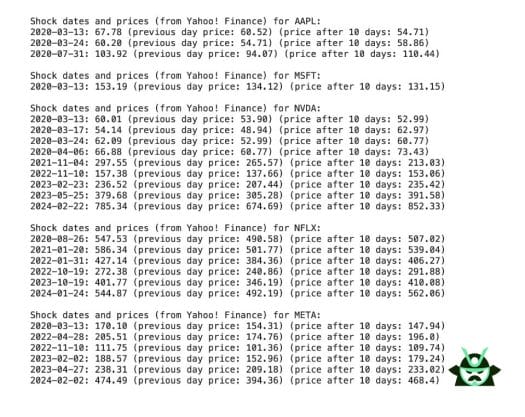
For instance, MSFT’s only significant event occurred in March 2020, during the early, confusing days of Covid-19. But looking at NVDA, even if we exclude the events from March-April 2020, there are several post-earnings reactions where the stock frequently failed to revert to its pre-shock level after two weeks. Note that you will find a complete list of these events right below the bar chart in our backtesting file.
This suggests that trading a 10% NVDA movement could likely yield profit compared to a similar event in MSFT. However, remember that past performance doesn’t guarantee future returns.
Negative Shocks
Let’s now examine the same five stocks, but this time focusing on negative shocks where a stock price declined by at least 10%. Here’s what we discovered:
- Both AAPL and MSFT had one such event each, and they both failed to recover (100% of cases).
- NVDA saw two cases of a -10% shock and managed to recover once (50% of cases).
- NFLX had 4 such events, failing to recover its pre-shock price 3 times (75%).
- META experienced 3 events and never managed to revert to its pre-shock level within 10 business days (100%).
Once again, here is what our bar chart looks like:
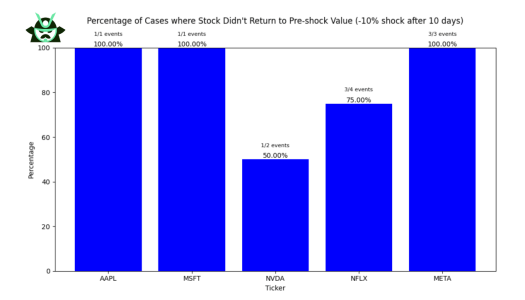
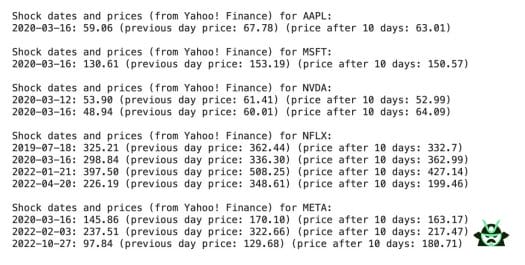
Particularly noteworthy are NFLX and META, which seem to struggle to recover quickly from a strong negative shock in the short term. We focus on these stocks because our backtesting analysis shows that the other stocks only experienced these events during the unusual trading conditions of 2020, due to Covid-19, corresponding to economic conditions that may not be applicable today, so take the backtest results with a grain of salt. Again, you can refer to a complete list of shocks right below the bar chart:
In summary, our backtest reveals interesting trends in how big tech stocks behave following significant price shocks. This analysis can provide valuable insights for options traders looking to take advantage of these scenarios. However, it’s essential to consider the inherent risks and remember that past performance doesn’t guarantee future results.
How to Trade Companies after a Price Shock
Here is our main idea behind this study:
- For stocks having recorded a positive shock, we’ll evaluate a bullish strategy. Specifically, we’ll look for a bull put spread (a credit strategy), which limits our losses and has a high probability of profit (but at the cost of capping our profits).
- As you may guess, we’ll look for a bear call spread (the opposite credit strategy compared to the one mentioned above) for cases in which the stock experienced a negative shock.
We’d choose to go with credit spreads to spot opportunities with a high-profit probability and a protection level just in case we are wrong.
Note that, depending on the way you like to trade, you may consider riskier approaches such as a naked put or a naked call strategy, or you may buy an ITM call (bullish case) or ITM put (bearish case).
When trading options after a price shock, predefined scans on Option Samurai can help you identify potential trades.
For positive shocks, you’ll want to search for “Bull Put Spread on Stocks that Experienced a Positive Shock,” while for negative shocks, look for “Bear Call Spread on Stocks that Experienced a Negative Shock.”
An Example of Positive Price Shock with Options Trading
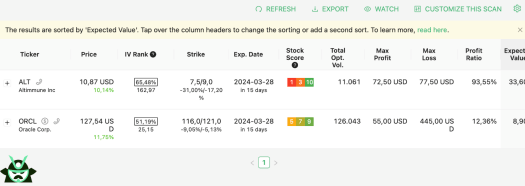
Let’s start with the “Bull Put Spread on Stocks that Experienced a Positive Shock” scan. We find two results: ALT and ORCL, sorted by Expected Value.
Now, remember: these scans are not meant to be used blindly. Always check what is the reason behind the positive or negative shock of a company before trading. For instance, we noticed that ALT’s high variation didn’t come with real news or an earnings report. This shows you our main idea, which is that you should go with this strategy if all the statements below are true:
- You don’t think the price will go back to its pre-shock level any time soon (i.e., the price movement should be motivated and not based on pure speculation)
- The backtest on the company validates your assumption
- You have a strategy with a good profit probability (for instance, above 80%) and limited loss (which is why we are looking into credit spreads).
Considering that ALT does not work for us due to the first point above, we shift our attention to ORCL.
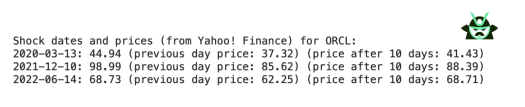
ORCL’s price rose by 11.75% following a very positive earnings report, making it an excellent candidate for our analysis. After adding ORCL to our backtesting, we see that when the stock price grew by at least 10% in a day over the past five years, it failed to revert to its pre-shock level within the following ten business days four out of four times. This 100% statistics – while not a certainty – suggests a strong chance of profit.
Our scan shows the possibility of creating a bull put spread by selling a $116 put and buying a $121 put, with ORCL trading at $127.54. For this trade to be profitable, ORCL needs to close above $120.45 by the time your options expire. Remember, a credit spread limits both your losses and profits, providing a safer strategy compared to a naked put approach.
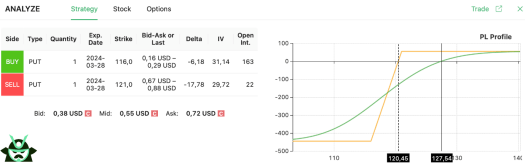
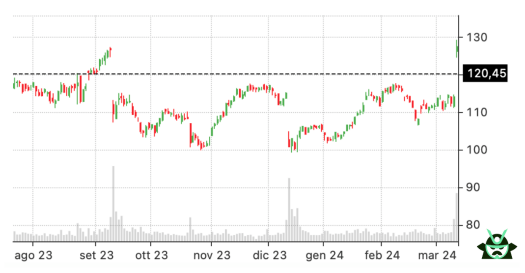
Looking at ORCL’s price chart, $120.45 is a resistance level that could easily become support, making this a potentially good trade idea.
Note that this strategy will give you a maximum profit of $55, and a maximum loss of $455. With a profit ration of 12.36%, ask yourself whether this is an appropriate strategy for you. It may not be a wrong idea to just sit and wait for a more appealing opportunity in the next days.
An Example of Negative Price Shock with Options Trading
The “Bear Call Spread on Stocks that Experienced a Negative Shock” scan can also yield interesting results. In this case, we only find one result: UVIX, a VIX-related ETF. After a -10.21% price decline, we need to evaluate our chances of success.
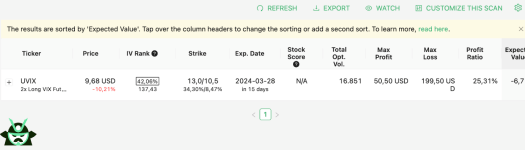
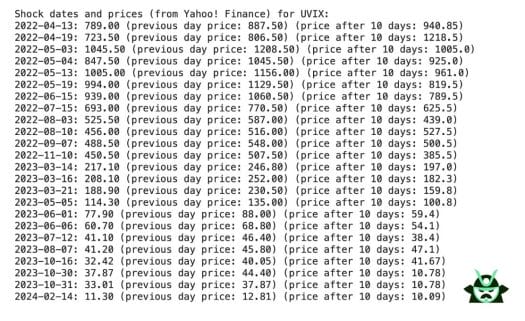
We can add UVIX to our backtesting page and look for instances when the ETF price declined by more than 10% in a day. Over the last five years, this event has occurred 24 times. Surprisingly, UVIX only failed to revert to its pre-shock level within ten business days 11 times (44%). This strategy appears riskier than the bullish case.
However, if you’ve done your research and believe that a bearish strategy is still favorable, you could follow the options screener’s suggestion and open a bear call spread trade: buy a $13 call and sell a $10.5 call. You’ll want UVIX to close below $11.01 by the time your options expire.
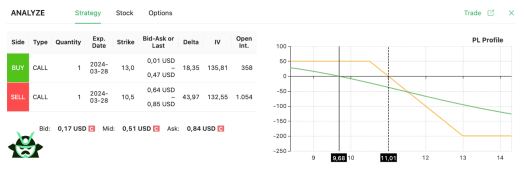
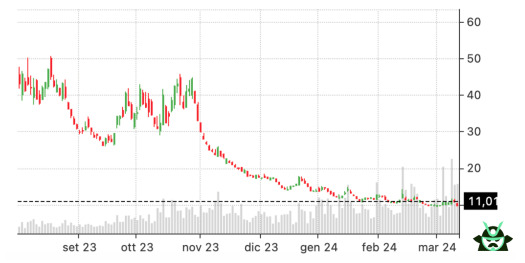
Given UVIX’s current trading price of $9.68 and its volatility (as you can see from the price chart below), you may want to skip this trade and wait for a safer opportunity.
With a profit ratio of 25.31% (we’re talking about a maximum loss of $199.50 against a maximum profit of $50.50), this strategy looks a bit more appealing compared to the one we saw earlier. However, once again, it is up to you whether to open this trade or wait for an opportunity with a better profit ratio.
How We Performed our Backtest (and How you can too)
The backtest we performed for this strategy was executed on a platform called Google Colab. Google Colab is a free cloud-based tool that allows you to run Python scripts, making it perfect for our backtesting needs (you need a Google account to use it). To get started with our backtesting file, simply click here and save a copy of the document to your drive. You can do this by clicking on File and selecting ‘Save a copy in Drive’.
Once you’ve got the backtesting file open in Google Colab, you’ll notice several variables you can adjust to suit your needs:
- Tickers: The first thing you’ll want to adjust are the ticker symbols for the stocks you’re interested in analyzing. Our backtest uses five ticker symbols as input. In our case, we used AAPL, MSFT, NVDA, NFLX, and META, but you can replace these with any tickers of your choice.
- Days: The “Days” variable refers to the number of business days after the shock during which you want to track the stock’s performance. We set this at 10 business days (or two weeks) for our analysis, but feel free to adjust this to match your trading strategy.
- Threshold: This variable represents the percentage value of the price shock you’re looking to analyze. For instance, setting this at 10 means you’re interested in instances where the stock price has increased by at least 10%. Similarly, a threshold of -5 would mean you’re looking at instances where the stock price has dropped by at least 5%.
Our backtest pulls stock data from Yahoo! Finance for a period of five years. We chose this timeframe as it provides a good balance between having enough data for meaningful insights and being recent enough to be relevant for current market conditions.
Once you’ve set your parameters, you can run the backtest by clicking on the ‘Run all’ option in the ‘Runtime’ menu. This will execute the Python script and display the results right in your browser. The results include a detailed analysis of each positive or negative shock event for each stock, along with a summary of the percentage of times the stock price did not revert to its pre-shock level within the specified number of days.
If you’re interested in diving deeper into the data, the backtesting file also includes code for visualizing the results. This can help you better understand the trends and patterns in the data and make more informed trading decisions.
We’d like to clarify that, while backtesting can provide valuable insights and help you develop a trading strategy, it’s not foolproof. Past performance is not always indicative of future results, especially if you consider that some of the past shocks were actually merely based on rumors or speculations that proved to be wrong, while others were more fundamentally sound.
Our backtesting strategy provides a practical and customizable way to analyze the behavior of stocks following significant price shocks. By adjusting the parameters to suit your needs, you can use this backtest to help develop your own trading strategy for earnings events.
Consider that this is just one of the many ways you could trading an earnings (or similar) event, as there are many different approaches designed for any type of trader (e.g., you could trade options on the idea that implied volatility drops after earnings and it is a mean-reverting indicator).
Check out our backtesting file
CLICK HERE TO OPEN OUR GOOGLE COLAB BACKTESTING FILE AND CREATE A COPY FOR YOURSELF

