IV percentile is one of the most important measures in options trading. It is also the most commonly used feature in Options Samurai options scanner. This article will discuss the Importance of the Implied Volatility percentile, IV rank, their formulas, uses, how to know if option IV is high or low, how to trade it, and more.
Key takeaways
- IV Percentile is a calculation used to give investors an idea if the IV of an asset is high or low at a glance
- Implied Volatility percentile (are rank) is important because IV is mean reverting. This means that after high IV, we can expect it to go lower and vice versa: after low IV, we can expect it to go higher.
- The IV percentile rank is standardized from 0-100, where 0 is the lowest value in recent history, and 100 is the highest value.
What is Implied Volatility percentile?
IV percentile is a ranking function that ranks the current IV of the asset with the asset’s IV over the last year. It is used to measure the current IV value and tell us if it’s high or low compared to the past. The IV percentile rank is standardized from 0-100, where 0 is the lowest value in recent history, and 100 is the highest value. This helps us to know if the IV is low or high at a glance. This is important because IV is mean-reverting, and after high IV, we can expect it to go lower, and vice versa – after low IV, we can expect it to go high.
If you are not sure what IV is. It stands for Implied Volatility. The Black–Scholes formula (B&S) is a mathematical formula that is used to price options. It takes several inputs (such as asset price, interest rate, volatility, time to maturity, etc.) and outputs the options ‘fair price.’ Out of all the inputs – the Volatility is the only one that is unknown. So, if we change the formula, we can derive the IMPLIED volatility from the market prices. Instead of using the volatility as input, we re-arrange the formula to get the IV as the output. This helps traders understand if options are expensive or cheap and helps them choose the best trades and strategies.
What does IV percentile mean?
The IV percentile is a rank from 0-100 where the lower the Implied Volatility rank value, the lower the asset’s IV compared to the past, and the higher the Implied Volatility rank value, the higher the asset’s IV compared to the past.
A common look-back period for the IV percentile is one year. So, if we see an IV percentile value of 90%, we can say that the current IV is greater than 90% of the IV over the last year (and this value is considered high). Similarly, if we see that the IV rank value is 25%, we can say that the asset’s IV is higher than 25% of the values over the last year. This means 75% of the IVs over the last year were higher, and it is considered a low value.
To better explain this, we can use an example:
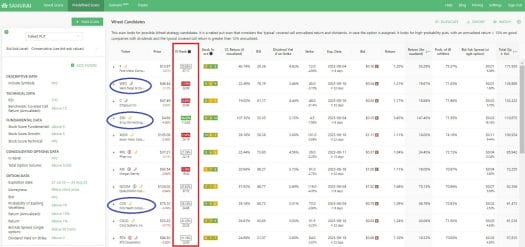
In the table above, we can see a result table from our Samurai’s Options Scanner. We can see the IV percentile highlighted in red (we call it IV rank). We can see two values in each row: The above value is the Implied Volatility percentile (30.56% in the first row, Ford). And the below value is the asset’s IV (37.17% in Ford).
If we focus on WFC and CVS for a minute, we can see that their IV is very similar (2nd value): WFC IV is 22.69%, and CVS IV is 24.86%. These values don’t tell us much about where the IV will go in the future and don’t help us to know what strategy to do. However, if we look at the Implied Volatility rank, we see that the WFC rank is 1.59% (extremely low, possible after an IV crush), and the CVS value is 55.16% (normal). This helps us as we can expect WFC IV to rise, and may be a good chance for debit strategies that will profit from a rise in IV.
Another example: We can see SIRI’s rank is 98.02%, and it is extremely high and probably going to fall. We can assume this is because of the coming earnings (orange phone icon), but this will be discussed in a different article.
To summarize: Using the IV Percentile rank, we can easily see if the current IV is low or high, and it can help us decide on our strategy and trade. In the example above;
- WFC IV is low,
- SIRI IV is high.
- and CVS IV is normal,
Why use the Implied Volatility percentile?
Different assets have different IVs, but The IV percentile is a standardized measure of how ‘expensive’ or ‘cheap’ the option is. This allows us to gain insight into the option’s relative price quickly and easily, even across different assets. The percentile function is an oscillated indicator and will enable you to identify the option IV high and low points. Just looking at the asset’s IV gives us a value for a point in time. It is hard to understand if it’s high or low – and even harder to form an opinion if it will go lower or higher going forward. But the Implied Volatility percentile ranks the current value compared with the past IV values, and it is standardized. So looking at it allows you to quickly and easily identify extreme cases and increase our edge. Additionally, using the Implied Volatility Rank in Options Scanner allows you to find high IV or low IV across the entire market and find the trades you are comfortable with.
What is a high IV percentile for options?
A high IV percentile for options is a value above 80%. This means the current IV value is higher than 80% of the previous year’s IV values. Research shows that after values of 80% and above, there’s a higher chance of IV decreasing compared with continuing higher. Just remember there might be a few days delay between when the IV first spikes and when it decreases.
When the IVP is high, options are priced more expensively. This is usually beneficial for option sellers, as they are compensated with a higher premium for the same risk. This means that option-sellers can choose if they want to take less risk than usual for the same premium – or if they want to take more profit for the same risk as they usually do. There is a mirror image for options-buyers who pay more for their positions.
What is a low IV percentile for options?
A low IV percentile for options is a value below 20%. This means the current IV value is higher than 20% of the previous year’s IV values (and lower than 80% of the values). Research shows that after values of 20% and below, there’s a higher chance of IV increasing compared with continuing even lower. Just remember there might be a few days delay between when the IV first drops and when it increases.
When the IVP is low, options are priced cheaper than usual. This is usually beneficial for option-buyers, as they are paying less for their options and the benefits that come with them (leveraged exposure to the asset).. This means that options-sellers can choose if they want to take less risk than usual for the same premium – or if they want to take more profit for the same risk as they usually do. There is a mirror image for options-buyers who pay more for their positions.
IV percentile formula
The IV Percentile formula orders all the past values from smallest to largest and then checks where the current value ranks compared to those values. It is easiest to do in Excel or Google Sheets.
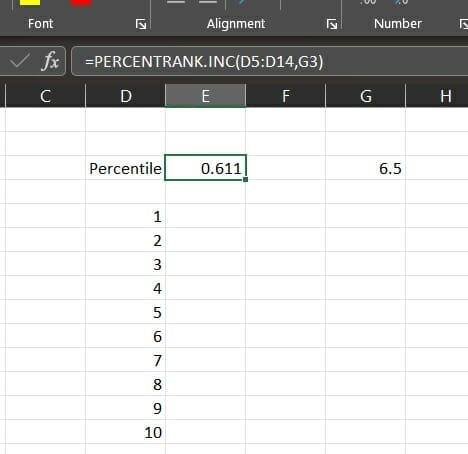
The IV percentile formula is:
=PERCENTRANK.INC(Array,X)
Where:
Array: The past values
X: The value we compare
Implied Volatility rank
IV Rank is a ranking method for Implied Volatility that looks at the highest and lowest IV values in the past and measures where the current IV is in relation to those values. It is also used for options trading to understand if the current IV of the asset is high or low and helps traders understand how to construct their trades. It is a standardized scale from 0 to 100, where 0 is the lowest IV in the timeframe (usually one year), and 100 is the highest IV in the timeframe. You can see IV rank as a great way to start trading implied volatility.
IV rank formula
IV Rank formula is simple once you know the highest and lowest IVs in the year. You just calculate the current IV minus the lowest IV and divide by the difference between the highest and lowest IV. Here is the formula:
[IV – Lowest_IV] / [Highest IV – Lowest IV]
What is the difference between IV percentile and IV rank
IV Percentile and IV Rank are both used for options trading and tell us the current level of IV compared to the past. However, the Implied Volatility rank only looks at the past highest and lowest values, while the Implied Volatility Percentile checks all past values. This is why we believe the percentile calculation is more robust.
The following picture will give a clear example of how different past values can affect IV rank vs. IV percentile and which one is better.
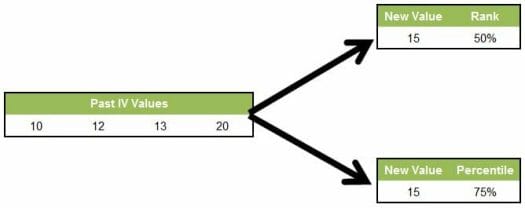
In the above example, we see four past values. Now we have a new value – 15, and we will calculate both the IV percentile vs. IV Rank:
- When calculating the Implied Volatility rank, we can see that 15 is exactly the middle between the highest and lowest IV values (10&20), and Thus, the rank will be 50%.
- When we calculate the Implied Volatility percentile, We can see that 15 is larger than three of the past values out of the four values in our set, so the percentile will be 75%.
- We feel that the IV percentile is a better indicator, and we use it, even if we call it “IV rank,” which we feel is the more intuitive way to understand it.
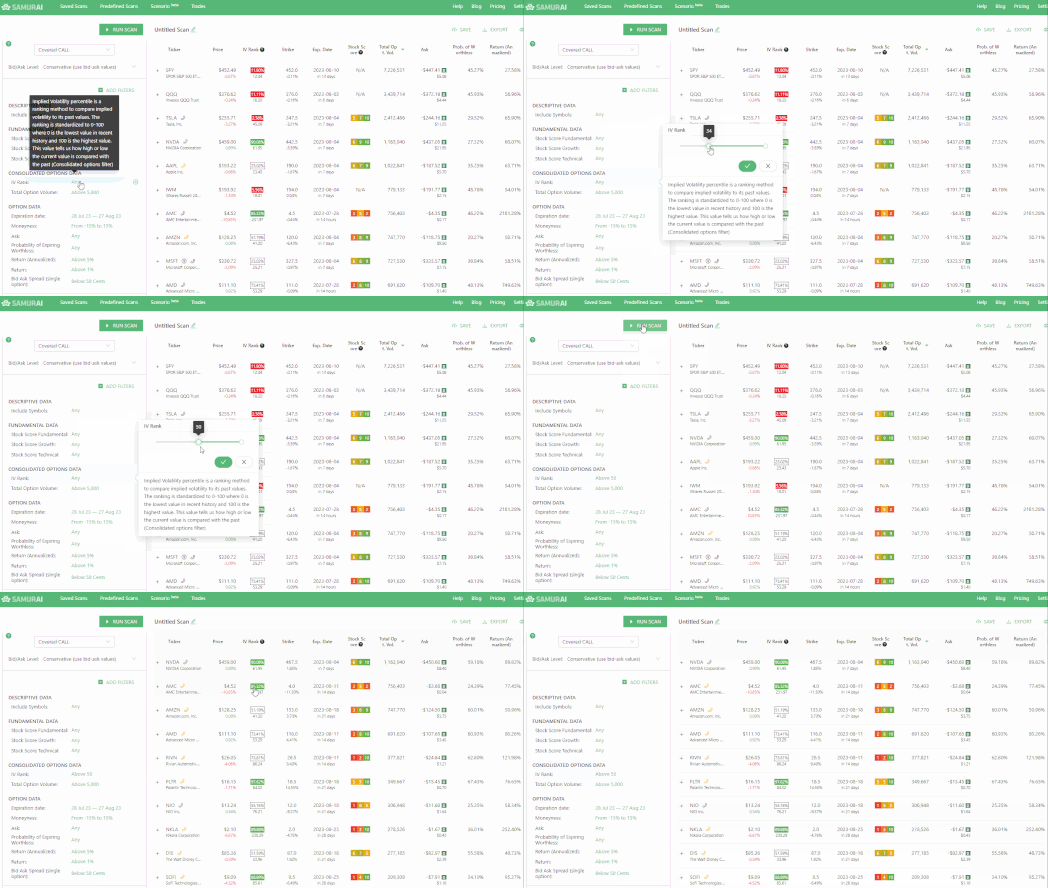
How to scan for the Implied volatility percentile in OptionSamurai?
Implied Volatility percentile rank is one of the most popular and useful tools in Samurai. Our users use it to filter the entire market and find trade opportunities that fit their style. You can use the Implied Volatility rank feature in:
Our scanner to filter trades that fit your strategy
In our pre-defined screens that help find trades according to different themes and get you started quickly
In our trading journal to see your current open trades and past trades
In our Excel and Google Sheets integration where, you can build custom tools.
And speaking of IV, you can integrate a volatility skew rank analysis in your trade selection process.
And more.
Implied Volatility Percentile is very useful mainly because volatility is mean mean-reverting, and the rank is a great tool to find points of extreme values and where the IV will turn back. You can check our research to see the backtests we ran to validate this.
[Originally published on 25 Jan 2015 and updated since]

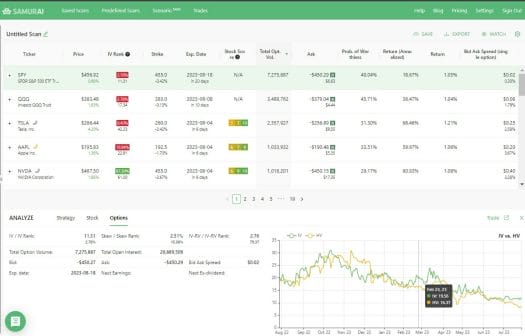

A good overview of Implied Volatility.
Thank you!