This is a multiple-article series. In part one, Implied Volatility backtest – Predicting IV Change, we discussed how the IV percentile predicts future IV change. In this article, we will test how the RV percentile affects the RV.
RV is short for Realized Volatility, often called HV – for Historical Volatility. This is a measure of the asset’s observed volatility over the last N days (we use one month). IV is what the market thinks the volatility will be in the future, while RV is what the volatility was really in the past.
In the last article, we saw that implied volatility (IV) is mean-reverting. So we wanted to check RV as well, and see how it can help us with our trading. Spoiler: It is mean reverting and can help us. Read on:
We have run backtests to measure the RV change from 2015 till October 2020, and these are the results.
Update: Part 3 is out: Implied Volatility backtest pt 3: IV and RV
Backtest RV on stock indexes
The table below summarizes the results between the RV percentile and the future RV change. Each row shows the results when the RV percentile was above or below the threshold. Each column indicates the change the RV saw in the next 5,10,20 or 30 TRADING days over the usual RV change. This corresponds to a week, two weeks, about a month, and ~45 calendar days.
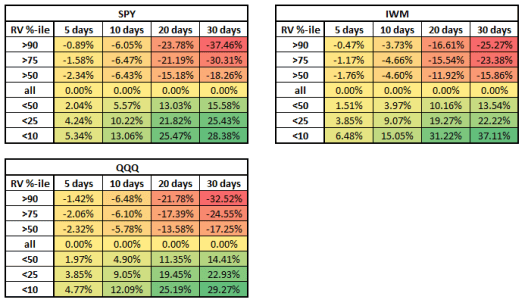
Example of how to read the table: In SPY – We can see that when the RV percentile was less than 10, the RV increased 28.38% more than usual in the next 30 trading days, and 25.47% more than usual in the next 20 days.
Using the indexes backtests, we can learn how to use the RV percentile to improve our edge in trading, as they exhibit the behavior we see in the market. Take a minute to check the tables, especially the five days and below and above the ‘all’ row.
Got it? Ok, let’s continue:
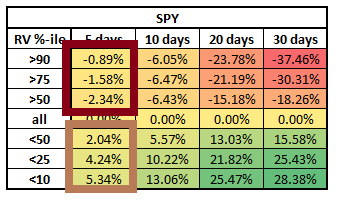
We are focusing on the short term (5 trading days): When we look at decreasing RV, we can see a mean-revision behavior as we expect: The lower the RV, the higher increase we will see after the threshold. While RV is below 50 percentile, we can expect a rise of 2.04% more than usual over the next five days. When the percentile is below 25, we can expect an increase of 4.24% and a 5.34% increase more than the usual RV change if the percentile is below 10.
This is a classic mean-reverting behavior – the more extreme the move, the more extreme the action will be to the other side.
However, when looking at increasing RV – above 50 percentile, we can see that the behavior has momentum in the short term. This means that if the RV is exceptionally high in the short term, we can’t expect it to decrease necessarily. In the longer term, though – a month and 45 trading days, we see that the behavior is as expected – the more extreme the RV to the upside, the stronger it will change to the downside afterward.
So the Key takeaway – The RV is mean-reverting but in the longer term. This means that we should ambush our trade, especially when RV is high (which will probably mean IV is high as well). When we see an extraordinarily high or low RV, we can add it to our watchlist (read how in our knowledge base) and trade it in a time delay when we see the trend is changing. Also – to use this edge, we should trade longer-term (30-45 calendar days)
Backtest RV on commodities ETFs
The following tables summarize the RV change over the regular change in the next X days after the RV percentile hits a certain threshold:
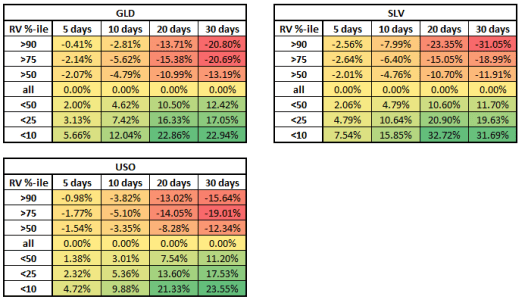
Similarly to the previous section – the RV is mean-reverting, but mainly over the longer term.
Key takeaway – Taking trades in commodities ETFs is similar to stocks – we should aim for a longer term and enter the trade in a time delay after an extreme RV rank reading.
Backtest RV on popular stocks
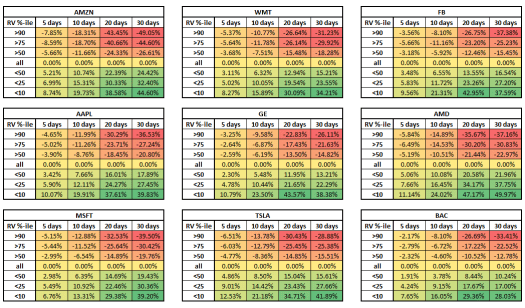
The following tables summarize the behavior of RV after an RV percentile threshold on popular stocks. If you want to see a specific stock, don’t hesitate to ask us.
Summary
In this article, we summarized the effect of the RV percentile indicator on future RV changes. We can see a very consistent behavior of long-term mean revision, coupled with short-term momentum. This means that to capitalize on this edge, we need to trade longer term and in a short time delay. It is still a mean reversion trade – when we see a high RV rank, we can bet that the RV will decrease, and when we see a low RV, we can bet that it will increase.
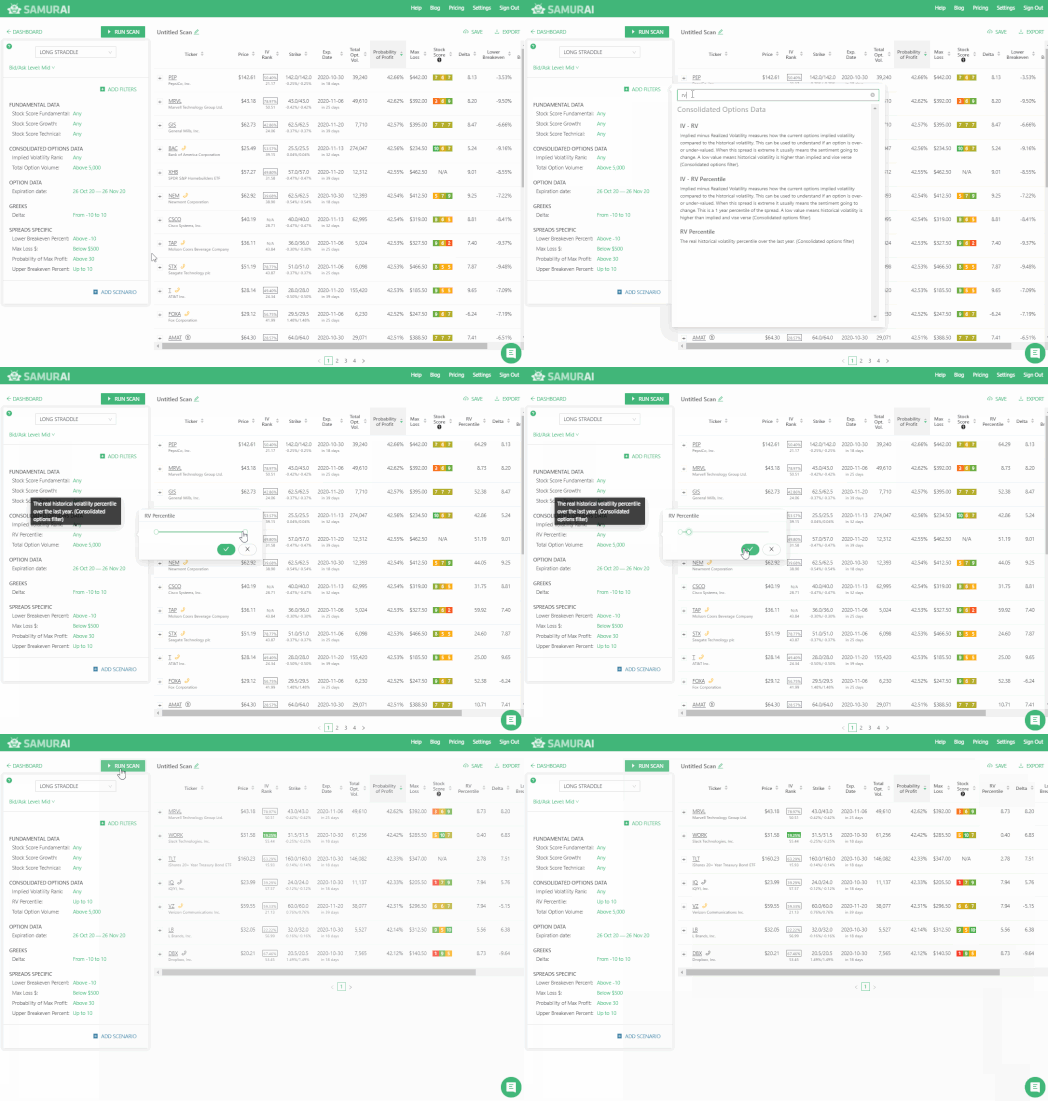
You can use the RV rank (percentile) in your trading right now by adding the RV rank indicator. BTW – we use the same data in the scanner and the research, so we expect similar results.
If you want to learn more about IV Percentile and its uses, you can read about it in our complete guide. Our implied volatility rank article can also guide you to improve your trading approach to options.
See how:
Go to option Samurai:


[…] [We have just added another article in the series, about the Real Volatility (or Historical Volatility) backtest. Check it here] […]
[…] Realized volatility backtesting and how to use it […]
Hi,
Impressive Backtesting guys.. I didn’t understand below line, a particular words are in a short time delay. Could please elaborate this more ?
This means that to capitalize on this edge, we need to trade longer term and in a short time delay.
Thank you!
I think we can also phrase it as ‘patience.’
We can see that stocks can be more extreme in the short term. So don’t trade as soon as it is extreme; check what led to this situation.
However, once you see those indicators turn extreme, you should have a bias towards mean reverting. Just don’t rush it. There is probably time to trade this asset, and there will be other opportunities as well.