When trading options, we often focus on option specific data points such as IV, time decay, volatility, the Greeks, etc. These are essential measures that are unique to the options realm. However, options are derivatives of stocks/indexes and thus derive value from the underlying business.
There are many ways to assess business value and analyze what stocks we should trade. Samurai’s platform is built with flexibility in mind to accommodate many trading styles. One of Samurai’s most useful features is the Stock Score, designed to help you understand the stock strength in a single view. The stock score is a fundamental-quantitative system that analyses the company balance sheet, income report, and cash flow report to rank the stock from 1 (weakest) to 10 (strongest).
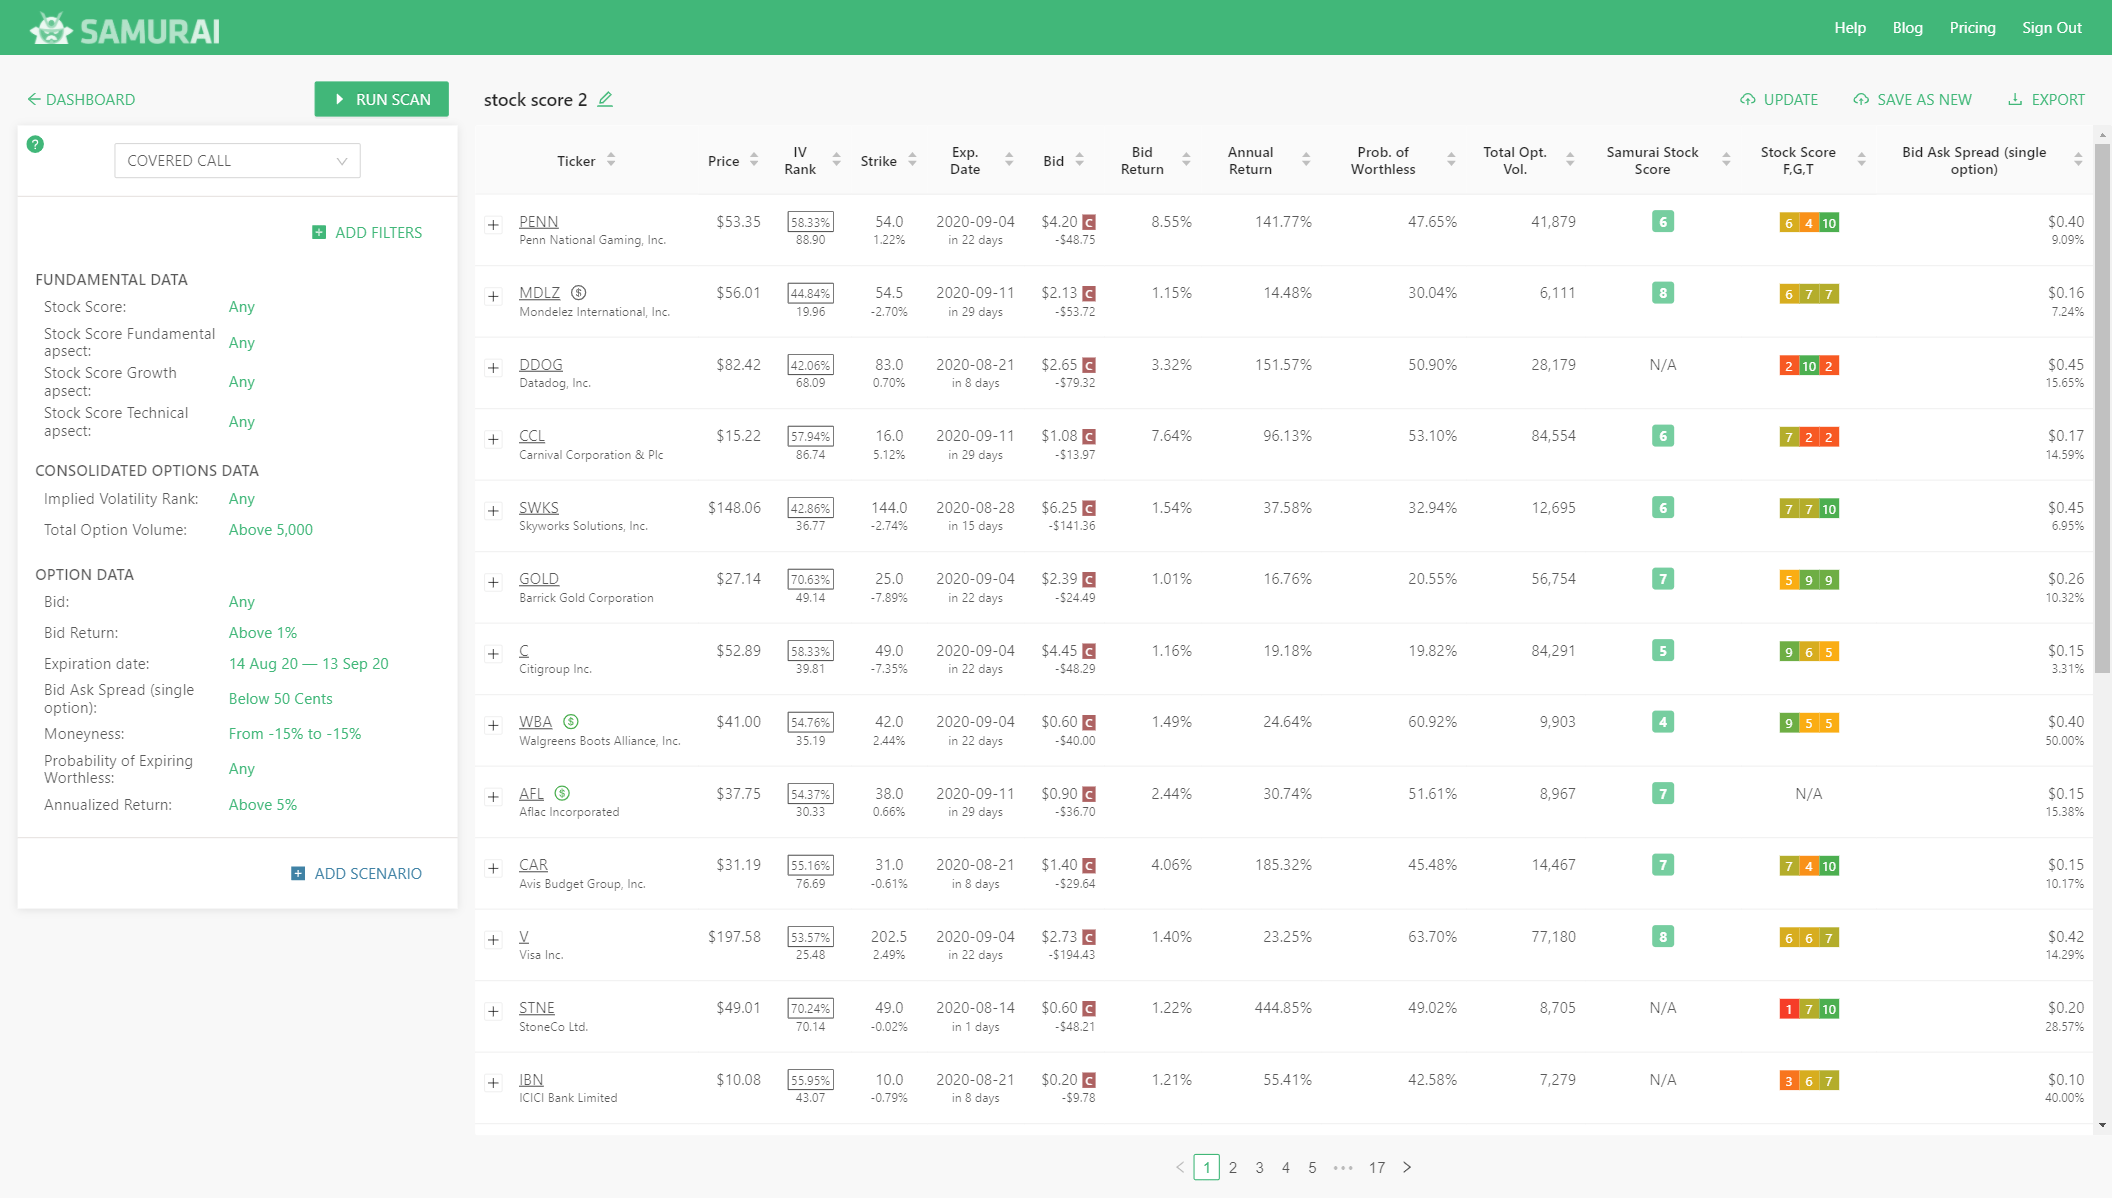
This data point’s fundamental nature helps us see information from a ‘new family’ of indicators – fundamental – to augment our technical, volume, options analysis, etc.
In our knowledgebase, we give more details into what goes into our stock score. In this article, I want to look a bit into specific examples of stocks and their score to understand better how to analyze the score and use it in your trading. The goal is that by learning about how we describe specific stocks and their score, you will gain a better understanding of the score itself.
The stocks described are NOT investment advice.
Example 1: $DKS – DICK’S Sporting Goods, Inc.

$DKS is a specialty retail chain that focuses on sporting goods, and it is in the cyclical consumer sector. The company has an excellent score: 10 fundamental score, 9 growth score, and 10 technical score. Let’s analyze:
Fundamental score highlights:
- The company sales are about $8.6B and a market cap of about $5B. The P/S is about 0.58 and is low for the sector.
- The PE is 19.4 on a $261m profit. It is not low, but the sector’s median is about 21.8, so not too bad.
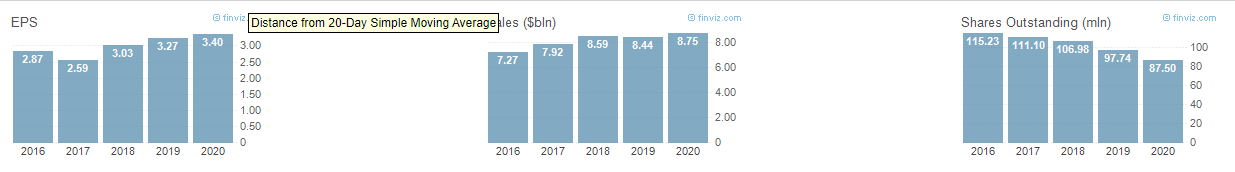
- The company shareholder’s yield is about 6.7%, with a 2.23% dividend yield, and the rest is buyback (See picture). This is considerably higher than the sector, as many companies are still diluting their investors.
- The company generates more than $1B in free cash flow, and the price to free-cash-flow is 4.5 and considers low. The sector median is 13.
- ROA is 3.6%, and ROIC is 7.1%, which are inline and slightly higher than the sector.
As you can, the company has a healthy profit and balance sheet. Next, let’s see the growth:
Growth score highlights:
- The company showed a YoY growth of 20.1% despite the COVID crisis (the sector showed a 20% decrease).
- EPS grew by 147.6%, and cash grew 460%. Both are above the sector median by order of magnitude.
- Over the past five years, sales and earnings growth are in line with the sector, decreasing the grade a bit.
- Looking at the analysts’ estimates, we can see that they are bullish on the stock and revised their EPS and sales projections.
- DKS had a positive beat last quarter but missed the quarter before.
Overall the company shows good growth in a sector that was hit by the pandemic. However, since it didn’t ‘checked all the boxes,’ the growth score is almost perfect.
Technical score highlight:
- The company is over performing the sector (16% to 3%)
- The company technical indicators are positive but not oversold/bought.
Summary:
$DKS has a great score that reflects the fact that it is a robust business that generates over $1B of free cash flow and grows in a sector that was hit by the pandemic. If we assume that the retail sector will perform ‘ok’ – DKS is one of the strongest companies in it.
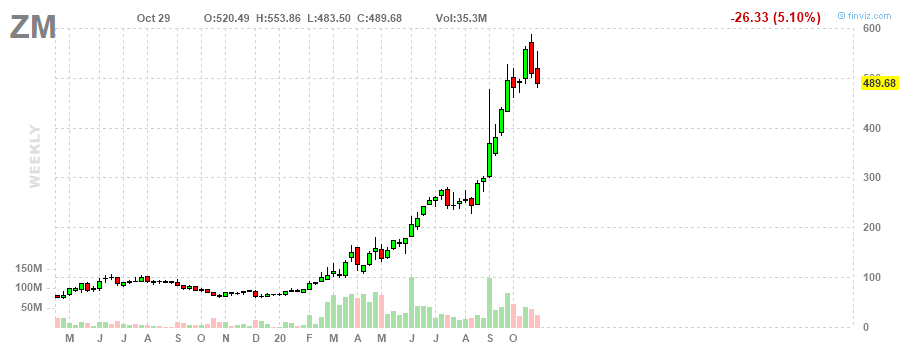
Example 2: $ZM – Zoom Video Communications Inc.

Zoom creates a video-first communication platform and web conferencing services. It saw a massive boost in its business due to the pandemic and the need for remote work, meet, and communicate. It is expensive, so fundamental grade is low, but growth and technical scores are very high.
Fundamental score highlights:
If you follow the stock market a bit, it should come as no surprise that the company is really expensive.
- The company Price-to-sales is 108, and PE is 659. These are unreasonably high numbers, especially when comparing with the communication sector (PS of 2.44 and PE of 30.2)
- The company price-to-book is 121.75 (vs. 3.43), and the price-to-free-cash-flow of 215 (vs. 24).
- The company’s quality is high; it has a strong ROA (12.8%) and ROIC (20%), both high and above the sector median.
- It is also generated about $760m in cash flow from operating activities.
Overall the company is extremely expensive but has high quality (even before analyzing its product itself).
growth score analysis:
The company showed ridiculous growth due to the pandemic:
- Sales growth was 147.8% (vs. 1.2%)
- It turned profitable
- Operating cash growth grown 651%
- $ZM had a positive earnings surprise in the two last quarters.
- The analysts are still bullish and revised the EPS growth even more.
Technical score analysis:
- The company has a bullish momentum with relative strength above the market, and the sector and technical indicators are not overbought.
Overall we can see that the company has high growth, good quality but extremely expensive. This doesn’t mean that it is a good or bad trade, but we need to remember that if growth slows, we might have a problem in the trade. This is a pattern we see often in the market: growth stocks continue to rise and outperform even when very expensive. In those cases, it might be a great trade, but if growth slows, we can’t turn a ‘trade into an investment’ because there is a risk we will need to wait a long time to recuperate the loss.
Example 3 – $TLRY Tilray Inc

Tilray is in the healthcare – pharmaceutical sector. The company is a supplier of cannabis for medical purposes. The company saw a massive increase during the cannabis stock boom, late 2018 but fell since then.
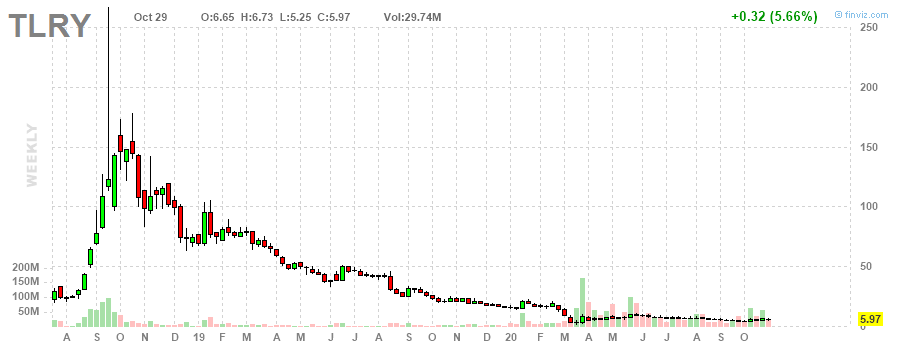
TLRY is a cautionary tale about investing in ‘hot’ companies even when growth slows, it has a fundamental score of 1, a growth score of 3, and a technical score of 2.
Fundamental score analysis:
- The company is losing money in its operation and has a 3.6 price to sales ratio (vs. 5.8 in the sector)
- it is diluting its shareholders by issuing new shares to fund operation (21% between FY2018 and FY2019)
- Since the company is losing money, it also has a negative ROA, negative cash-flow, and increased liabilities.
This gives us a low score of 1 – the company is expensive, and the business is not high quality (compared with other companies in the sector)
Growth score analysis:
- The company shows less than 10% YoY sales growth, which is low for a company in its growth phase.
- The company has increased its losses.
- TLRY had negative surprises in the last two quarters. The analysts are bearish on the company and have adjusted their projections down.
- The company shows excellent operating cash growth, and the analysts see it generating profits in the future.
For a company in its growth phase, a growth score of 3 is terrible, and we can see why – the company is not growing fast enough and failing to meet analysts’ expectations. A growth score of 3 can be ok for a big company, but not a small one in the growth phase.
Technical score analysis:
$TLRY underperforms the sector and the market, but indicators are close to being oversold, so the score is 2.
As mentioned, TLRY is a stock that shows bad fundamentals and growth, it is a cautionary tale for when growth stocks collapse. It is hard to believe a sustained increase in the stock price unless the business will turn around (and the growth numbers will be the most important).
Summary
In this article, we analyzed three examples and how their stock score corresponds to fundamental data points. There are dozens of data-points going into the score, but the bottom line is that it gives you an understanding of the:
- Cost and quality of the business (fundamental score)
- Past growth and future analysts’ projection (growth score)
- Stock momentum and relative strength (technical score)
And all of this in a very easy to use data point.
General notes on how to continue:
- Use the score to compare companies from the same sectors and competitors to identify potential winners better.
- The score is important in the context of the ‘investment thesis.’ If a growth stock has a low fundamental score (meaning expensive), it might be ok, as growth stocks (such as AMZN, TSLA, ZM, DOCU, etc.) are not priced based on the past numbers. Similarly, if an established company has low growth stock – it might be that it’s the sector is hurting, but it will profit in the next cycle (for example, the oil sector).
- The return goes hand in hand with risk. However, if you use the stock score to filter all stocks that are bullish (in bear strategies) or bearish (in bull strategies), you will save a lot of time in your analysis.
- You can sort by the score to save even more time analysis.
- If a stock has a bad score in one of the categories (fundamental, technical, or growth), you can check only this area and make sure you still want to invest.
-
Go to Samruai to use this feature now: Option Samruai.
-
Please read about the score on our knowledgebase: here.

