This is the fourth part of our in-depth look into the various edges traders base their decision making. You can see part 3 here, and all related articles here. Those who are subscribed to our newsletter are familiar with this indicator: It is based on the market IV and indicates when it is too high, and there is an edge for downside or too low and there is an edge for the upside. In this article we will describe the indicator in more details.
The volatility indicator is cyclical, so when the implied volatility (IV) is high you should use strategies that profit from volatility drop, and when IV is low you should use strategies that profit from volatility rise. So, when it comes to trading implied volatility, this is certainly a good thing to know.
The Indicator ranks the 200 last values of VIX, normalized to 100. When checking how current values effect future values – we see a clear indication that when the value is high – future value will be low and vice verse.
- Learn more about the IV percentile and it’s edge in our complete guide.
- Learn more about Skew and Volatility Skew Rank here.
- Learn more about the implied volatility rank and it’s edge in our complete guide.
Backtested Results:
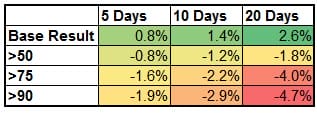
We checked the results of the IV indicator from 2005 – 2015 (10 years). We checked the average change in VIX, compared with different values of percentile rank.
When IV is High:

We can see that the average change of the VIX over 5 days is 0.8%. When the VIX percentile value is above 50% (above median) the subsequent VIX return is -0.8%. When the VIX percentile value is above 90% – The subsequent VIX return is -1.9% (in 5 days). We can see that the VIX future return when percentile is high is negative.
When IV is Low:

We can see that when the VIX percentile value is below 50 (below median) the subsequent VIX return is 2% – positive. We can see that the subsequent VIX return when VIX percentile is low is positive and substantially higher than the base result.
The Backtested results affirm the market “wisdom” of buying low IV and selling high IV. Use this indicator to better position ourselves within the market.
We saw this happen live. We wrote about the plunge and the VIX in our article: The markets plunge – what does Vix tell us? – Check it out.

