This is the third part of our in-depth look into the various edges traders base their decision making . You can read the previous part here and all of the series here. This methods are based on quantitative systems built from several logics that examine different market mechanics.
In this instalment we will look in-depth into a market breadth indicator. For this indicator we look for % of stocks about 20/50 MA. We examine the S&P 500, and so when the indicator is 80% it means that 400 stocks (80% from 500 in index) are above the 20/50 MA. The logic here is that market correction is inevitable so when the indicator is at extreme, it signals that the market might “pause” before reversing or continuing. We implement a market breadth indicator in our widget to have a better view on the market condition.
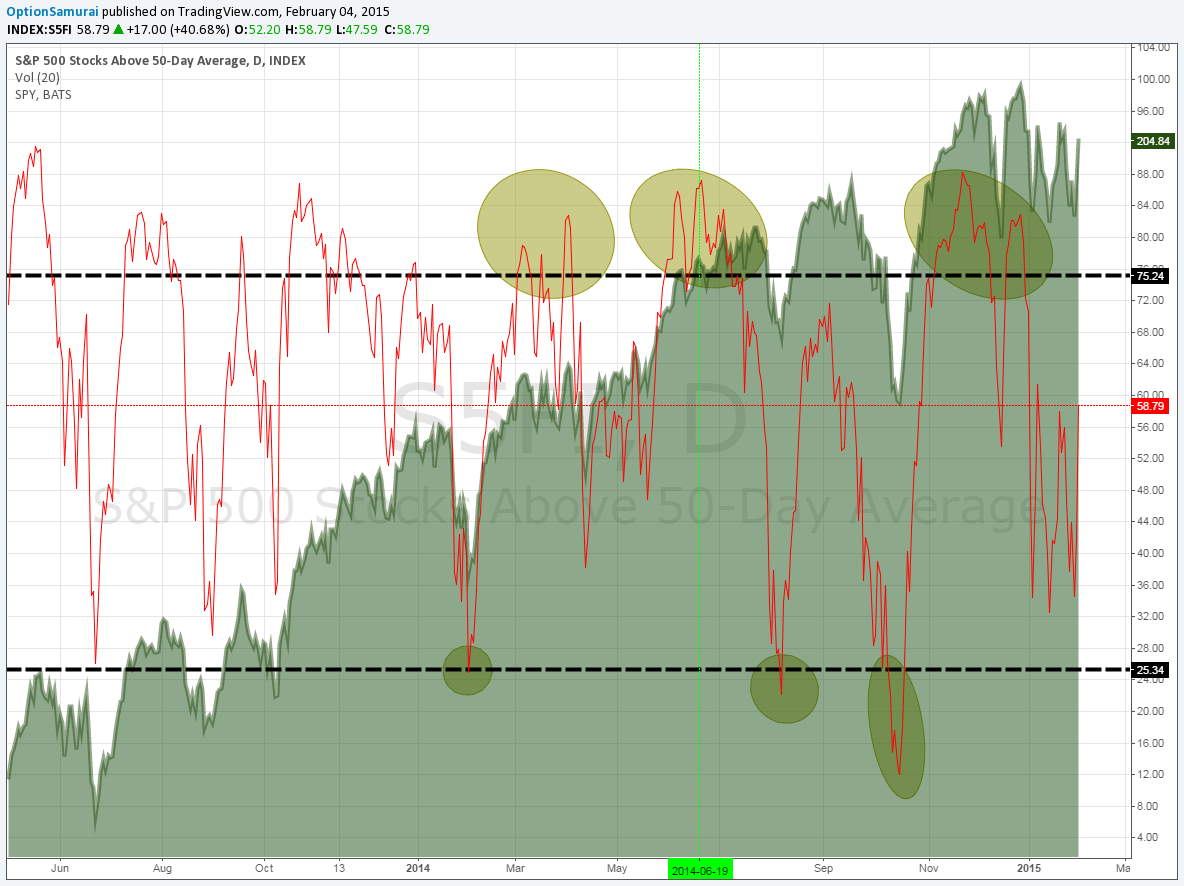
Looking at the above picture we can see that the SPY (green) is in a clear up trend. The red line is oscillating and is on the right axis. The red line is the % of stocks above 50 day moving average. Since we are in an up trend we can see that the indicator is above 75 (extreme) more often than it’s below 25.
However we can see that when the market reached those extreme values it usually stopped and reversedpaused. Since we are in a uptrend, the low extremes (under 25) were good buying opportunities and high extreme signaled a pause before continuing the trend.
Mathematically:
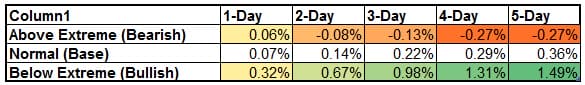
The following table is a summary of results from Jan 2012 till Jan 2015. It describes the average market performance if bought at close when Market breadth indicator was at extreme (above 75 or below 25). And sold X-days later. For example:
- We can see that buying when indicator is above 75 and held for 3 days yields an average negative results of -0.13% . This is Lower than the average market return for 3 days which is 0.22%.
- We can see that buying when indicator is below 25 and held for 1 day yields a positive result of 0.32%. This is Higher than the average market return of 0.07%.
We can see that the extremes present an edge when comparing to the regular market yield for the same time frame.
We incorporate a more complex market breadth indicator in our system, but the idea is the same.
- Join our newsletter for a weekly analysis of the market breadth

