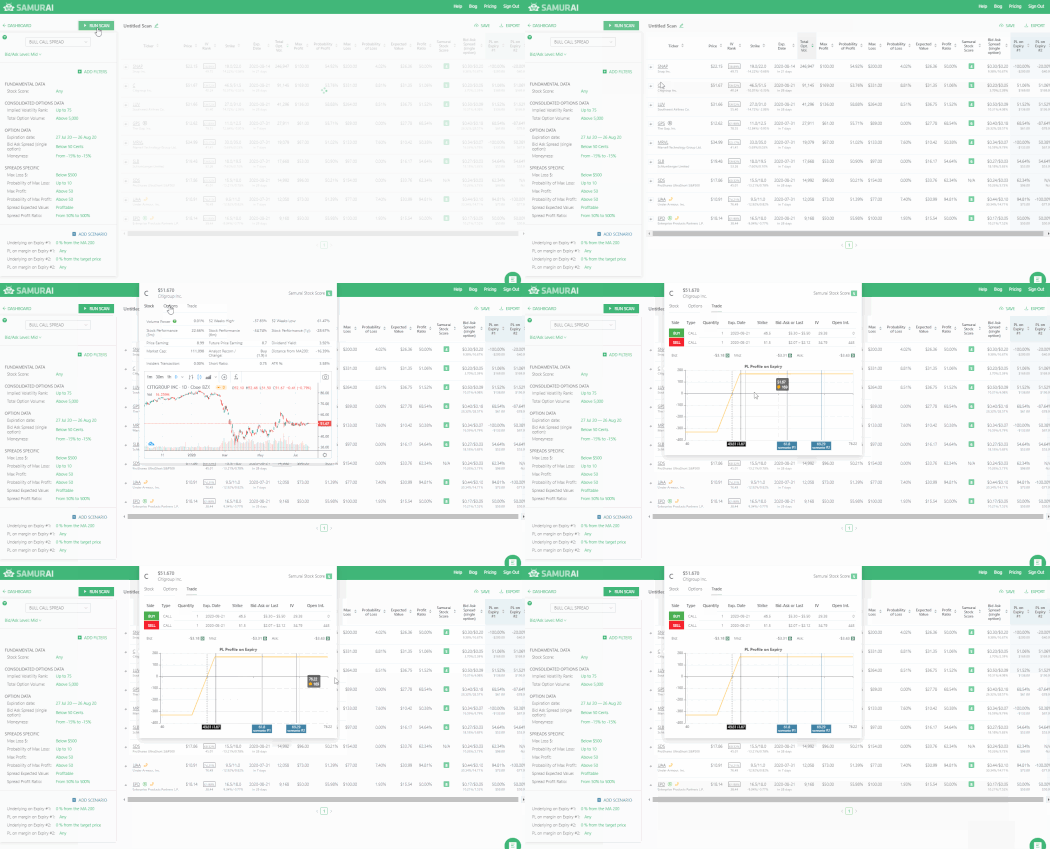
We are happy to announce that we have recently deployed another new feature – the Trade tab. In the Trade tab, you can see the Profit and Loss (P/L) of the strategy in different strike prices, and do advance analysis on the option trade you found using our scanner.

To get to the Trade tab, click on the symbol and pick the ‘Trade’ tab in the top part of the window. It works on both mobile and web.
Trade tab sections:

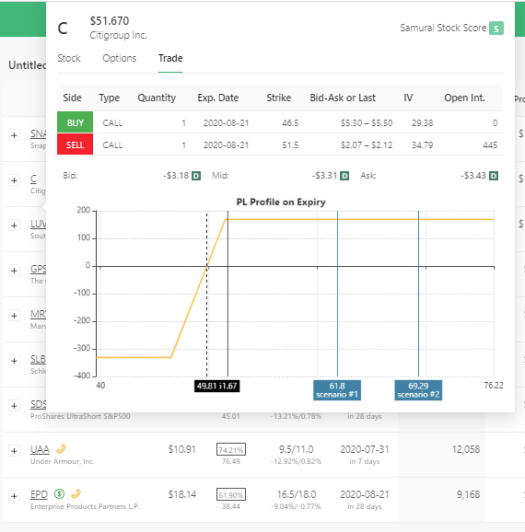
Trade Legs: You can see the different trade legs in the strategy, with the Bid and Ask prices and the IV and Open Interest.
Strategy price: You can see the strategy Bid, Mid, and Ask. The small ‘C’ near the strategy indicates Credit, and ‘D’ means Debit.
PL Chart: Here, we graph the Profit and Loss of the strategy and help you visualize the profit and loss areas on the strategy. You can see the current price (black line), break-even points (dashed lines) and scenarios (blue lines).
Powerful combo

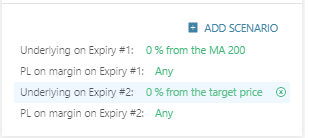
The Trade tab works well with the scenario engine we launched earlier this month. You can add scenarios and see them on the graph so it will help visualize the scenario. Here are two examples you can try:
Add MA200 and analyst target price: You can add the moving average 200 days and the analyst target price to your trade tab. Just add two scenarios: one will be 0% away from 200 MA, and the other will be 0% away from the analyst’s target price. Once you click the ‘run scan’ and the columns populate, you can see the blue scenarios in the analysis tab.
Add one standard deviation above and below current market price: Add two scenarios, set one to be 1 standard deviation above, and the other to be -1 standard deviation. Click ‘run scan,’ and once the columns populate, you can see them in the analysis tab.
You can access the feature right now on our system so click the button and create an account.


