Option Samurai has two predefined scans that help you find unusual options volume across the entire market. These scans help you see what the ‘smart money’ in Wall St. is trading. There are many ways to trade these options, and you can customize the scan for your needs. In this article, we will cover one way to trade these alerts and give you a framework to incorporate this into your trading.
Before we start, let’s explain: What is unusual options volume, and why is it important?
Unusual options volume is when the daily activity on an option contract is much higher compared with the regular activity on that contract and compared to the activity on the rest of the options chain. Higher activity means that more sophisticated traders and more market makers are now paying attention to this stock and specifically to this option contract. Since these players work tirelessly to maintain their edge in the market, the unusual options volume serves as a ‘footprint.’ It allows you to know that something is interesting in this asset, and it might be beneficial to look into it and ‘ride’ the trade with the players.
This connects us to the second point: why is it important? These players spend a fortune to gain an edge in the stock markets. By uncovering their footprint, you gain insight into their trades, and you can follow them if you want (or take the reverse trade).
- Update: You can also check our Center of Mass report in the article: How to use the Options’ Center of Mass report to sharpen your trading edge.
Unusual option volume screener
There are more than 4,000 optionable stocks and over 1.1 million options. Some options are traded a few contracts a day, while others trade tens of thousands every day. How do you know if an activity is unusual?
Option Samurai allows you to account for this by scanning according to intraday options volume, stock volume, options volume vs. open interest, etc. You can customize the scans to fit your needs, but we think you should start with the predefined scans and go from there.

To see the unusual options volume scan, click the ‘unusual volume’ tag, and then click on the ‘edit’ button for the scan you’d like. From there, you can sort, add columns, remove results, and make some adjustments to find better what you are looking for and how to trade it. Remember that for every buyer, there’s a seller, so we need to make some analysis in order to find the best trades. To make this process a bit clearer, let’s start with an example, and then go over the general concepts.
Unusual Call Options Volume
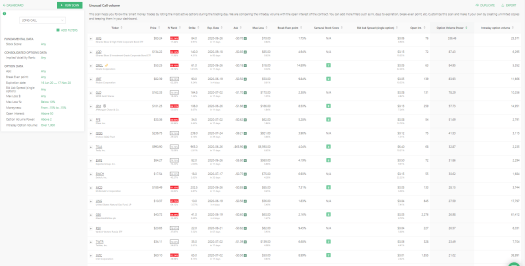
For this example, let’s start with the unusual call options volume scanner. We will click ‘edit’ on the scanner in the predefined scans section and see all the results in the ‘compose scans’ window.

In the beginning, the scan is sorted by options volume power (option volume divided by the open interest). During the trading day, the results, and their order, will change, and it is helpful to watch this list throughout the trading day to have the pulse of the market. Depending on the day, I usually adjust the minimum requirements to be on the scan. I remove some assets that I don’t expect to trade (using the ‘exclude symbols’ filter), and I frequently change the sorting by options volume power and intraday option volume to see what trades top the list in both sortings.

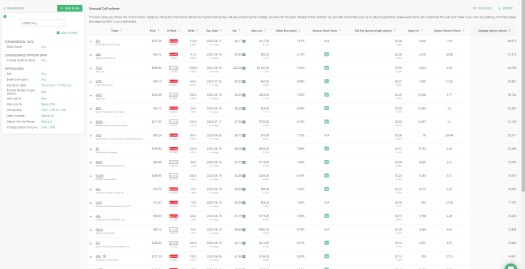
In this example, you can see that GSK appeared very high in both scans. It has 27 options volume power (meaning the intraday volume was 27 times the open interest), and one option was traded over 61K contracts during the day (topping many other assets that are usually more active).
Another key finding is that the option is very close out-the-money, and expires in 4 days. It tells me that whoever put on this trade is expecting a rise in the very-short-term, and I don’t need a considerable increase to see a profit. So, I’ve opened a chart to see the momentum and technical situation of the stock:

Before continuing, it is essential to note that I’ve also checked ORCL, as it has high volume and very high volume power. However, it has earnings, and the strike is further than in the GSK case. I’ve decided against that trade at this time as earnings trade requires a different analysis that we will cover in a separate article.
Back to GSK: Another test we need to pass is the ‘chain test’ – this means we want to check the option chain for GSK and see if the entire chain is active, or one option in particular. This can help us understand if this is a short-term bet or a more substantial position. By pressing the ‘+’ icon near the ticker, I can see more options for that symbol that fit the criteria.

You can see that option strike 41 is much more active than the other strikes, and it is less than 1% away from the current price, so I think it will be worth my time to analyze it (I’ll also check on the broker platform, but I’m still doing the quick analysis to understand if it is worth my time).
After I decided that this trade was worth my time, I also liked the fact that it is a short-duration trade and limited-risk trade (only $60 per option). There are many ways to manage the risk and money of the portfolio, but having a defined risk also means I can risk about 0.5% of my portfolio and know that it would be the worst-case scenario. GSK ATR is about 2%, and break-even is 2%, so I feel comfortable taking the trade.
Since I know that many players are looking at this stock, I’d look to scale in my position, and I won’t rush in. Even if I miss this trade, I will find a new one with the scanner, so I can relax and know that I’m trading only what I feel comfortable, for the price I feel comfortable with.
I’d also scale out of this position when I see profit, as this is a very short-term trade, and time is against me.
To recap:
- GSK option strike 41, which is less than 1% OTM and four days to expiration, is traded at unusual call volume both in absolute numbers and relative numbers. This tells me that it might be a good bull trade.
- The market is volatile (good) and is bullish (good)
- The stock is in the healthcare industry (good during a pandemic) and is in a sideways-bullish trend. Looking at the chart, I can see that there is room to grow (good).
- GSK ATR is about 2%, and break-even is about 2%, so even a random move could bring me a profit.
- Risk is defined, and liquidity is tight. I can scale in and out of the trade.
The quick analysis I did, convinced me that I have an excellent risk-reward for this trade. So I’d slowly scaled into the position. Although the option closed at $60 (ask), We could have entered at lower prices during the day.

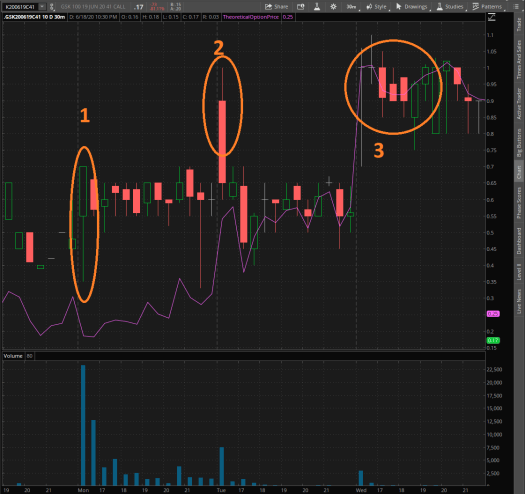
Since we are in a bullish market and this is a bullish trade, I’m a bit more patient when the trade doesn’t go immediately my way. I used the day of the signal (#1) to scale in the position.
After we scale in the trade, we can also scale out of the trade. This will help us reduce the risk and improve our overall performance by having smaller losses when we are not correct. As the option opened high during the next day, I managed to exit some options around 0.8 (about 60% profit – #2 in the chart). However, my other orders were not filled. While I could have exited for profit (15-20%) during the day, I thought that the break-even point was so close to the upside that even a small movement could lead to higher profit. I managed to exit the rest of my positions the following day (#3) for almost 100% profit. I opted not to wait another day as expiration was looming closer.
To recap the trade and money management:
- I scaled in the position during the day of the signal as it was a bullish signal, and we are in a bullish market.
- I took the first chance I had to book some substantial profits, leaving the rest to grow.
- After the stock failed to continue higher the next day, I exited all of my positions, as expiration was very close.
How to use unusual options volume
After the example, I’d like to try and formulate the process of how to use the unusual options volume. Since there is a seller for every buyer, just looking at the volume won’t give us a high enough success rate. We will need to better analyze and understand the current market conditions in order to execute profitable trades consistently. If you need another example, you can check our: Unusual Option trade on $DD article.
Step one: Pick a scan
Focusing on bullish trades or negative trades will help your success rate. You will get better at picking the trend with experience, but for beginners, it is crucial to trade with the trend and not try to predict it.
Step two: Follow the scans during the day
Many traders think that just because there was a big trade, it means that they can jump on the trade and profit. It happens, but the success rate is too low. For every buyer, there is a seller, and everyone knows it will leave a footprint, so we don’t always know the whole story. This is why it is essential to have a higher-level view, look at the other stocks, look at the chain, see the development over the trading day, and switch between the way we measure unusual volume (sweeps, vs. OI, outright volume, etc.).
Step three: Favor short-term trades that have close break-even point compared with ATR
Unusual volume usually indicates a short-term momentum. It will also increase our probability if the break-even for the trade is near, so even ‘luck’ can lead to profits.
Step four: Look at the chart
It is vital to gain a basic understanding of what we are trading, what the trend is, etc. While it is possible to profit from going against the trend – it is much easier to trade with it.
Step five: Understand the risk
Many trades we will take are buying options for a few days. This means that we can expect to lose ~100% of the money invested if the trade doesn’t go our way immediately. This is why we only risk a small amount of our portfolio each trade (tip: If a stock has weeklys, you can pick the option for the next expiration to have less volatility and risk – but also less profit potential).
Step Six: Patience
You are using Samruai now 🙂 There will always be another trade. Don’t feel rushed or that you have to trade. Gain as many advantages to your side. Scale in positions. Favor limit orders over market orders.
Step Seven: Take profit quickly
Scale-out of positions and book some profits quickly and reduce risk. Having a trade log will help you understand your sweet spot.
Step Eight: Log
It is important to log your trades (simple Excel would do). It will help you analyze your trades and improve your style with time. This is the key to long-term success. It will help you understand the exit points, how many entries you need, what are the important parameters for the trade, etc.
Our Options Scanner has predefined scans that will help you get started trading unusual options volume. Join now, and you can start your 14-day free trial and try our scanner and see how it can help you find trades. The key benefit is that we can help you build a diversified options portfolio and find trades in many styles – from unusual options volume through selling options and finding the optimal iron condor to building a covered calls portfolio for the long run.
Log in to SamurAI to start your free trial and check the unusual options volume.


Excellent article I did the GSK trade in similar lines but your clarity in steps to follow is very useful.
Thanks!