Options players are considered a sophisticated group of market participants. Every day, millions of different options are traded on thousands of stocks. The nominal value of those options exceeds the trading volume of those stocks by orders of magnitude.
If we could see where the ‘center of mass’ for the traded options is, we could gain an insight into what the options market ‘thinks’ about the stock’s future price. A backtest performed shows that this factor has alpha in the market.
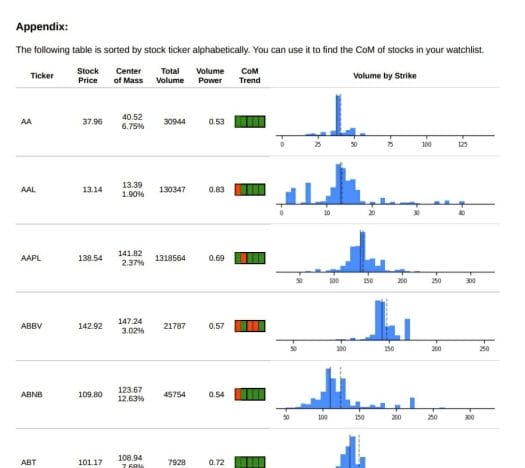
Options Samurai’s Center of Mass (CoM) report allows you to take advantage of this unique data point.
This article will cover the following:
- What is the Center of Mass report?
- What is the Edge?
- How to use this report?
- Real-life examples.
What is the Center of Mass report:
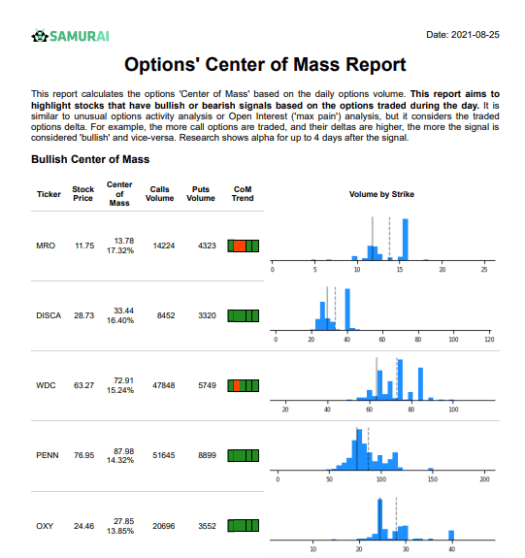
The center of mass (CoM) report is one of our premium reports that gives a unique analysis of the stock market. It is designed to highlight stocks with bearish or bullish signals based on options traded during the trading day. It is an options volume indicator and part of the unusual options volume ‘family’ and the Open interests (‘Max Pain’) ‘family.’
The report aggregates the entire option volume for each stock while considering their strikes to discover the options’ ‘center of mass’: Where most market participants trade the options.
The ‘Center of Mass’ indicator is based on an article from the University of Miami Business School by Gennaro Bernile, Fei Gao, and Jiangeng Hu. See the article here.
The CoM is presented as a price we can compare to the current stock price. In the research, the authors show that the CoM has short-term alpha when predicting the stock’s future move (in the next four days).
Why is the center of mass report interesting? What is the edge?
Options traders are considered sophisticated players. The CoM report is designed to see where is the ‘center’ of all their trades; this is where they think the stock will be at expiration. We can gain insight into their analysis and future projections by comparing this center to the current stock price.
In the academic research done by Gennaro Bernile, Fei Gao, and Jiangeng Hu from the University of Miami, the authors calculated the CoM of all stocks. Secondly, they sorted them according to the distance from the current stock price. Then, they divided the entire universe into ten groups, with 10% of the stocks in each group. With that, they’ve built a long-short portfolio where they bought the top 10% and shorted the bottom 10% of the stocks. This method of a long-short portfolio is a popular backtesting mechanism as it excludes the general market return from the analysis – and focuses on the factor we want to test.
Their analysis shows an alpha up to 5 days after the signal. See chart:
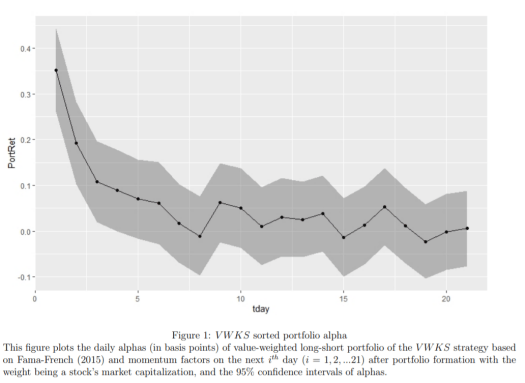
The article shows a slight edge even 15 days after the signal, but it is the strongest and most significant in the first five days.
To summarize: The Center of mass shows the aggregate position of the options traders. They are considered more sophisticated players, and their hedging could support the movement of the stock to the CoM. Additionally, a backtest performed – shows an edge when using this factor.
- Read about our Unusual options activity (with step-by-step guide)
Examples of how to use the report
While this report shows a clear analysis of the center of mass vs. the current stock price, and it is very tempting just blindly to trade it. We can’t do that. This signal is very noisy, and we should use it in our analysis while also considering other factors. We must remember that this is a daily report – so there are always stocks that are ‘extreme’ compared to the market. Also, the backtest was done comparatively to eliminate other factors that might affect the stock. When we trade live – those ‘other factors’ will be in play and could strengthen or weaken the CoM signal.
Because of that, we suggest following this report over time and following the stocks in your watchlist, as changes in this report can precede changes in the stock – especially if you are following it and you know what other factors can affect it.
Extreme distance + Volume power
The first way to use the report is the most intuitive: compare the CoM to the current stock price.
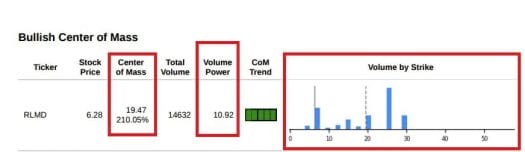
The logic is that the options player may predict a strong move in the stock. Additionally, if they open a position – market makers will hedge with a stock position – creating pressure on the stock towards the center of mass. It is crucial to check the reason for the difference – did the stock move away from the center for a fundamental reason (then the CoM will probably move to the new stock price, and the signal is weak), or did the CoM move away from the current stock price (can predict a move).
Since Extreme distance is a point-in-time signal – it is very noisy. Therefore, we suggest comparing it to the volume power indicator to see if there were more options trading than average. This would indicate how ‘sure’ the options players are in their ‘center’ and somewhat reduce the noise.
- Small note: If you are checking the intraday report – remember that even if the volume is low, it can still be larger than the average volume by the end of trading, so give more leeway to the intraday report than the end-of-day report.
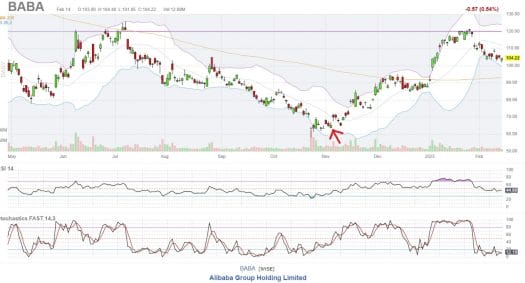
Example use-case: $BABA
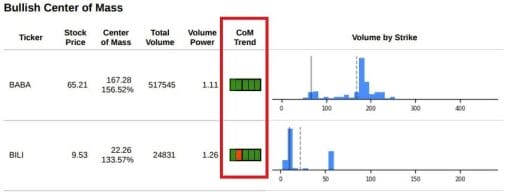
Chinese stocks got hit hard during 2021-2022 due to valid concerns about China’s political and business environment. So even if the company had a solid business (like Alibaba – Ticker $BABA), it got hit hard – from around $300 at the highs to about $60 at the lows. Nevertheless, during the second half of 2022, more and more hedge funds and other players started talking about $BABA as a lucrative long opportunity, as the company had a solid and resilient business. On Nov 3rd, $BABA appeared at the top signal position in our CoM report. The CoM trend is positive, options volume is high (11% above average), and the options market ‘center’ was 50% above the current market price.
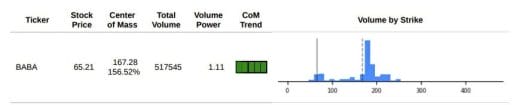
Following that signal, the stock moved about 85% in two months, so traders had time to join this movement.
Center of Mass Trend
The CoM trend shows how the CoM changed in the last five days. If it went up compared to the previous day, the indicator would be green, and if it went down, it would be red.
If we see the CoM above the current stock price and the trend is consistently bullish – we can say that the options market is bullish on the stock and vice-versa. Since the trend indicator is trailing for five days, it is slightly lagging and less noisy.
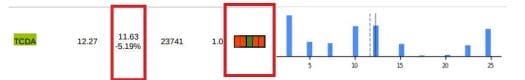
Example use-case: $TCDA:
This example was brought to our attention by one of our premium users. We appreciate the use-case provided by our users – so if you have a story for us – please update us.
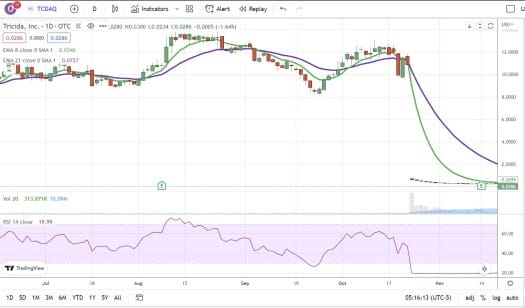
Tricida (Ticker $TCDA) is a pharmaceutical company focused on developing a unique drug. The nature of these stocks is that there is a binary event when the drug trial is released, and we learn if the drug has the desired effect.
Our user held this stock, and he tracked the changes in our CoM report. Around 14-17 October, he noticed that the CoM trend had turned negative. Since he knew the binary event was coming and the market was in a bearish trend, he decided to exit his position.
Shortly after, the results were out, and the stock lost 95% of its value in one day. This unique analysis helped him reduce the risk in his portfolio and avoid a huge loss.
Watch list
Another good use case is using this report as a unique indicator for stocks in your watchlist.
This is a unique analysis and can augment the stocks you follow daily. It can help you time your entries/exits or help you decide where to put stop-loss and take profits. Since you follow those stocks anyway, you’d be less affected by the ‘noisiness’ of this indicator.
- You can also create a watchlist in our Option Scanner and scan it regularly or set up alerts.
Conclusion
The Center of Mass report is a unique analysis that gives us an insight into the options market and the options players. We can find otherwise unavailable trade opportunities by comparing the current stock price to the ‘center’ of the options market.
Adding this tool to your toolbox can improve your trading and your edge.
Read more:
- Knowledgebase article – Link
You can gain instant access to all our features and more here:

