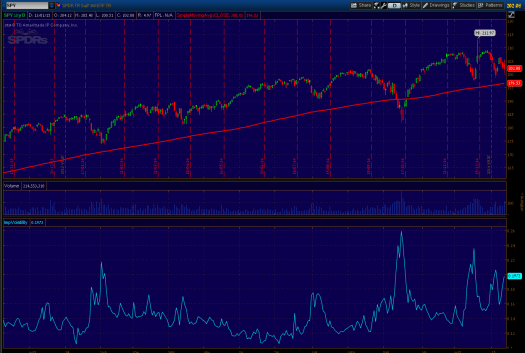
This is the second part of a four (very important) part post about how to better trade implied volatility. Most sources (educators, websites, etc.) give a lot of misinformation about trading implied volatility. Though the basis of their reasoning is true, the description is very shallow and can cause investors to make bad decisions if they don’t understand the implied volatility characteristics.
- Read part I in our series: Trading Implied Volatility – Part 1 – Predicting stock movements
- Read part III in our series: Trading Implied Volatility – Part 3
The basic advice of being an option seller when the IV is high and an option buyer, when the IV is low, is true (and I will talk about it in the second part) but is too simplified. I wish to elaborate in this post on another characteristic of IV – predicting (you can also call it trending)
The Options Market is efficiently priced – There is no edge when trading a “simple” system in it. Put options often are not efficiently priced due to the fact that market players see them as “insurance” – I might talk about it in future posts. Implied volatility is the market players’ “prediction” about future stock move.

We can see that the IV fluctuates, but it’s only easy to find the tops and bottoms in retrospect. In real-time, it’s very hard (and I will talk about how to do it in a future post). Looking carefully at those fluctuations, we can see that oftentimes the IV precedes large moves, and often lags (for a short time) and return to normal after the realized volatility. To summarize:

We conducted many backtests to measure the effect of the rise in IV. For example, we checked $AMZN between 2012-2014: We checked what was the Average True Range (ATR) during this time and we check the future ATR14 (for 1, 10 and 20 days in the future) during high and low IV :

We can see that the realized volatility 20 days after high IV regime is 0.9% higher than average. We can also see that the realized volatility 20 days after low IV regime is 0.4% less than average. These results happen across multiple assets and time frames, and are similar to results in academic papers, like this one.
The important takeaway here, when trading implied volatility – is that since options are correctly priced – high IV usually precedes high REAL volatility. This means that you should “automatically” sell options when IV is above HV or when it’s “high”. The idea is to scan for extreme values or special situations that give you an edge. Furthermore – you can enjoy the rise in volatility by buying options or stocks.
In optionSamurai, we rank the IV in order to understand if the IV values are high or low. Here is how you can easily scan for stocks with extreme IV values:
- Read more about the IV Percentile, the edge of implied volatility, and how to use it in our complete guide,


