Implied volatility is one of the most important concepts in options trading. This is the measure most market players use to check if an option is expensive or cheap. In this post, we will be showing you how you can use the IV percentile (we call it IV rank) to gain an edge in trading.
What is implied volatility?
Implied volatility is a “plug number” that when used as input in Black-Scholes formula, it yields the current option price in the market. The idea is that there are often discrepancies between the theoretical option price according to B&S, and the market price of an option. The implied volatility is used to reconcile these discrepancies and “explain” the market price. We use IV because it is the only ‘unknown’ variable in the B&S formula (Strike, the underlying asset, time to expiration, etc., are known).
What is the implied volatility percentile? (or rank)
The IV value represents volatility but doesn’t provide us with enough information on how to know if the volatility is high or low. Without more data, we can’t know if a value of 0.35, for example, is high or low. We use IV rank to give you more information about that fact. A value of 90, for example, means that the current IV is higher than 90% of the past 200 days. Click here to read more about IV Percentile (and how to scan for it). Also – you can check the difference between IV percentile and IV rank.
The IV percentile edge
Implied volatility is cyclical. After high volatility, we will see low volatility and vice versa. The key is to know when the IV is high and when it’s low. For this, we will use the IV percentile. In the past we showed that the $VIX tends to go up after low values and down after high values.
That shows the average $VIX change after percentile value :
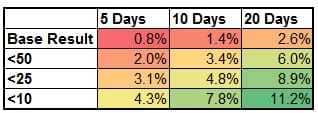
This IV behavior also occurs in stocks. Here we will show the results of the backtest we conducted on 5 liquid stocks. The backtest was March 2013-March 2015 for $AMZN, $GE, $MSFT, $AAPL and $WMT.
Here are the results:
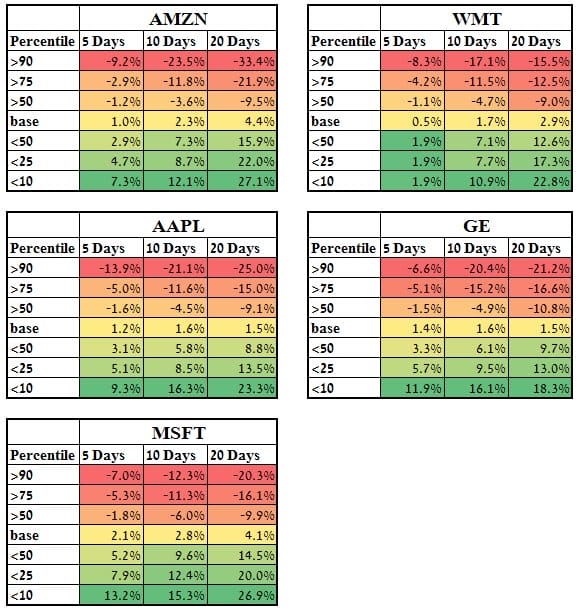
How to read the tables: For each stock, we have the base result – the average IV change for X days over the last 2 years. Then, we have the average IV change when the IV percentile was greater than the value (top rows) and when the IV percentile was lower than the value (bottom rows).
For example, IV change for AAPL Over 5 days when IV percentile was greater than 90 was -13.9%. This is even more important because the base result is positive: 1.2%.
We can see that this result is consistent across values and across stocks. The higher (or lower) the IV percentile, the more extreme the volatility swing will be to the other side.
We ran more backtests on Implied Volatility; check them out in our article: Implied Volatility backtests
Summary
We can see that the IV percentile is Cyclical. This means that when the IV percentile is high, we should look to sell options – and earn from the IV drop. Strategies like covered call, naked put, naked calls, credit spreads etc – will have greater chances of success.
When IV percentile is low we should look to buy options. Strategies like long call, long put, calendar spreads etc – will have greater chances of success.
It is important to be aware of the IV in the market and the stock you are trading so as to increase your chances of success.

