As 2023 is coming to an end, we want to take some time to reflect on what we’ve accomplished this year (and it was a lot 😉 ).
Last year’s summary was colored by the bear market and the fact that the main indexes dropped about 20%, with most popular stocks dropping much more and going through a repricing, which means that they will not recover their 2021 prices in the foreseeable future. However, we were long-term bullish on the market and the economy and delivered many cool features that are being used regularly (Excel integration and stock scenario, for example).
This year, we saw a bullish trend that increased the interest in the stock market, and once again, we saw bullish sentiment in comments, stories, risk-on assets (such as Bitcoin), and more. The main indexes rose about 20% and are once again around the 2021 levels – but this time, mega stocks such as Apple, Google, Microsoft, Nvidia, etc. are leading the markets and not the SaaS companies or other risk-on assets.
Looking back at 2023, we showed up daily to improve Samurai and help our clients succeed. As traders ourselves, we think that it’s important to show up and improve constantly. We are happy to apply it to our trading and our product.
Here are some of the main features we’ve added this year:
Live UI Update

We’ve improved our backend and front end of Samurai to give a better user experience. Gone are the days of refreshing the page to see updated information. The implemented live UI updates allow you to view data changes without needing a page refresh. This feature streamlines your scanning experience.
Open Interest Report

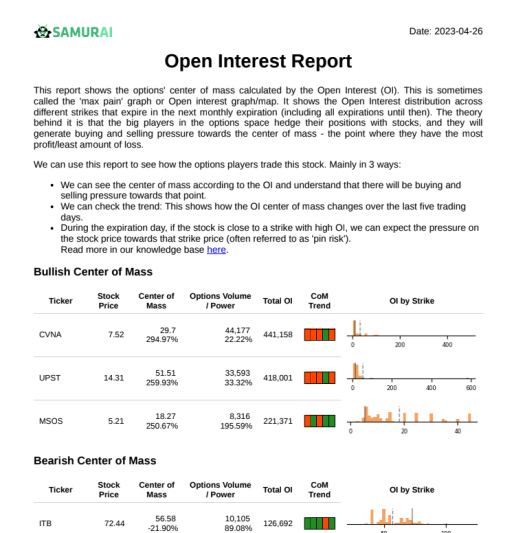
Following the launch of our Center of Mass report and the reports system in 2022, this year, we’ve added another custom report. The Open Interest report gives you another view into how the options market is positioned in different assets and can help you see underlying trends and pin risks at expiration. You can read more about it here.
Implied Volatility vs. Historical Volatility Analysis

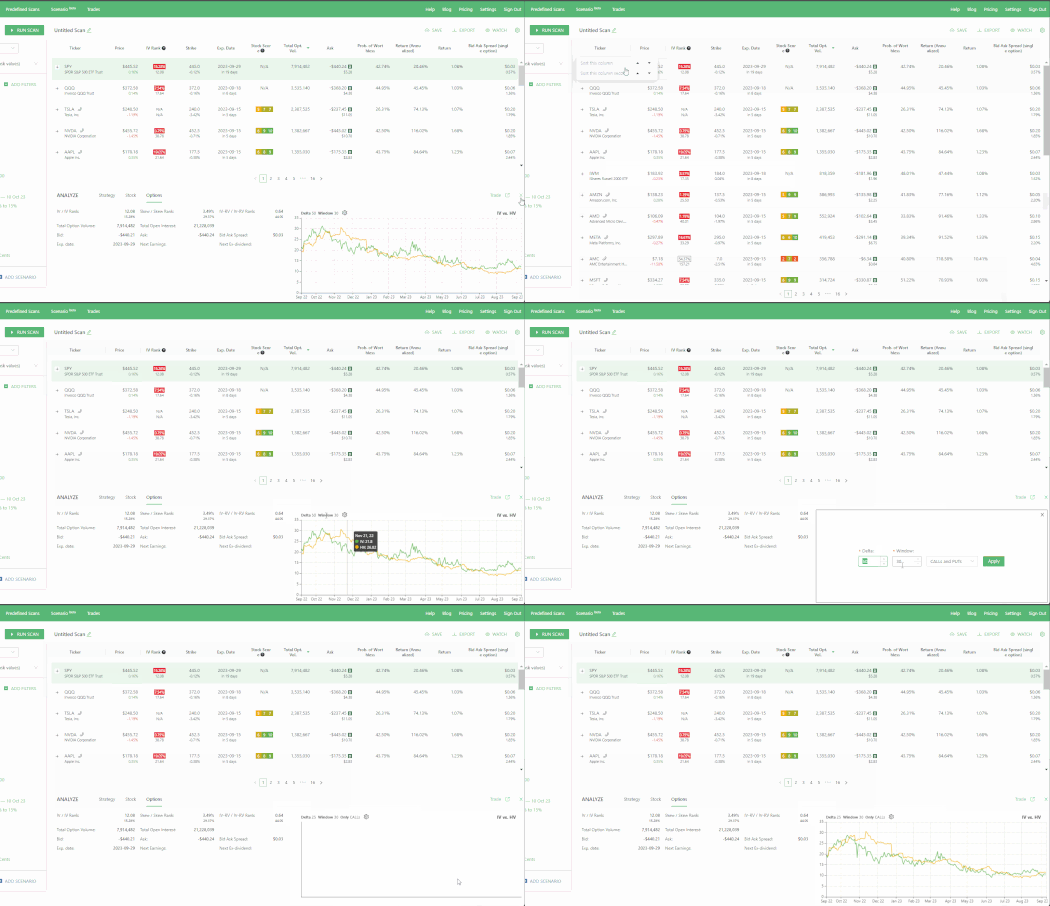
This year, we’ve significantly improved the IV vs. HV analysis on the details page. Previously, the IV was 30 days-to-expiration IV of ATM call and put options. But now you can change it and control the IV duration and options. This allows you to do better analysis that fits your trading style. If you want to trade short-term options, you can set the analysis for nine days (for example), and if you are looking for a long-term position and want to ignore earnings, you can set the IV to 100 days and see overprices/underpriced options in those time-frames.
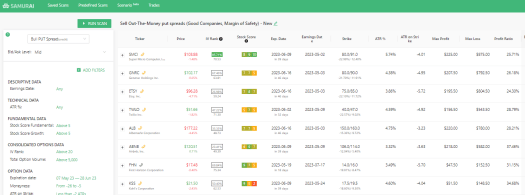
Improved Scanner
We’ve continued improving our scanner and ensuring it is the best in the market. The improvements were across all aspects of the site, and here are some highlights:
- We’ve added fundamental information such as debt, sales growth, etc.
- We’ve added new and improved filters to control multi-legged strategies with strike distance and delta filter.
- We’ve added options information filters such as intrinsic/extrinsic values and options intraday price change.
The improvements also made it easier to control butterflies and iron condors and find the best trades in the market for those strategies.
Other Improvements
- Improved scenario engine data, speed, and reliability.
- We’ve added more data to the Excel integration and templates to help you get started and get more ideas.
- We’ve added more free educational material to our blog and help section. This helps you be a better trader, even if you are not our customer.
In this article, we’ve described only the most important additions of the year. But we’ve added other features and improvements, and you can be sure we will add more features in the coming years.
You can check our update stream to stay up-to-date with our latest improvements.

One last thing: We are running a Christmas sale with discounts on our yearly plans. If you want to join us for the ride in 2024 and have a continuously sharper edge – now is a great time! Check it out in the link below.
You can gain instant access to all our features and more here:

