
We are happy to announce that the June version is now live. This month we’ve continued to improve our stock scenario model: We’ve added new and improved ways to define the scenarios and enhanced the range strategies.
This month’s features:
- Better definition of the scenario: You now can define scenarios according to variables such as standard deviation, ATR, distance from Moving average, and more.
- Unbalanced strategies: When selecting range scenarios, we now also check unbalanced strategies (non-symmetrical Iron Condor, for example) to check more possibilities and help you find the optimal way to trade the scenario.
- Improved range calculation: You can now define a range between any two numbers and see the expected P/L in that range.
- Bug Fixes and improvements – We’ve continued to deliver improvements and bug fixes according to your feedback.
Better definition of the scenario
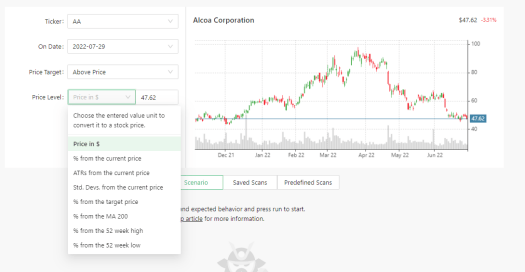
You can now define your scenario with variables that help you find better trades. For example, you can specify a scenario for a stock where it will be at the analyst target or below 52-weeks-low and find the optimal trade for it. Additionally, you can use volatility measures, such as ATR or standard deviation, and define scenarios with that – for example – find optimal trades for $BAC if it will be between a range of 2 standard deviations below and one standard deviation above the current price. Possibilities are limitless and will allow you to find better trades.
Unbalanced strategies
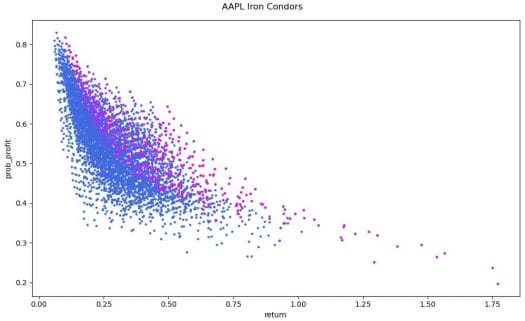
When picking a range scenario (within or outside a range), we now check all possibilities for the strategies – including symmetrical and unsymmetrical (and unbalanced) strategies. This increases the compute and wait times exponentially (since there are millions of possibilities) but has the potential to find trades that otherwise will be too hard to find manually. We continue to work on this feature and provide ways to make it faster.
Improved range calculation
You can now enter a range between 2 numbers, and we will calculate the expected P&L according to our Monte Carlo simulation for that range. This is very useful if you see the ticker is range-bound between support and resistance, or you expect a stock to not move much until earnings or a big event.
Bug Fixes and improvements
We’ve continued to deliver improvements and bug fixes according to your feedback.
The version is now live and available to use.
Maintenance note: Starting Q3, we will deliver quarterly versions to allow us to provide more features in each version.

