In the world of options trading, where strategic decisions are vital, grasping volatility dynamics is key. Traders often focus on Implied Volatility (IV) and Historical Volatility (HV) – IV signifies future price expectations, while HV looks at past price moves. This article explores the significance of these metrics, highlighting the key distinctions between IV vs. HV (Implied Volatility vs. Historical Volatility). By uncovering insights from implied volatility historical data, traders can gain a nuanced perspective, bolstering their capacity to navigate the dynamic options trading landscape.
Key takeaways
- While IV projects future volatility, historical volatility (HV) measures past price fluctuations
- Implied Volatility tends to anticipate changes in historical volatility, building a well-known relationship in the options market, as proven by implied volatility historical data
- Regular monitoring, adjustment of strategies, and debunking common myths about Implied Volatility vs. Historical Volatility are essential for successful options trading.
What Is Implied Volatility
Implied volatility (IV) is a critical concept in the financial world, particularly in options trading. It is a metric that reflects the market’s expectation of future stock price volatility. In short, implied volatility predicts future underlying volatility based on the prices of current options.
IV helps traders assess risk and make informed decisions. When implied volatility is high, it implies that the market expects the stock price to move significantly, either upwards or downwards. This could mean higher risk but also potentially higher returns.
IV usually predicts future volatility in the short term. It acts as an indicator of what the market anticipates in the immediate future, helping traders prepare for potential price swings.
Moreover, IV in options tends to move before HV (historical volatility). This means that shifts in implied volatility often precede observable changes in a stock’s historical price behavior. Savvy traders pay attention to IV movements for early signs of market shifts.
An aspect to consider is that IV can tend to overshoot. When you see IV very high, it may indicate that, in the short term, the stock will experience significant price swings. However, in the mid to long term, this could also imply that options are overpriced, and the actual volatility may not be as pronounced. Conversely, when IV is low, it might suggest relatively stable short-term prices but could indicate underpriced options in the longer term.
You can read more about it in our blog post on the topic on implied volatility backtesting.
Now, let’s talk about implied volatility vs. historical volatility. While IV projects future volatility, historical volatility (HV) measures past price fluctuations. The comparison of implied volatility vs. historical volatility can provide valuable insights into market sentiment. For instance, if IV is greater than HV, it may suggest that traders expect more volatility ahead.
What Is Historical Volatility
Historical volatility (HV), also known as statistical or realized volatility, is a measure of the fluctuations in the price of a security over a specified period in the past. It is calculated by evaluating the standard deviation or variance between returns from that security.
In contrast to implied volatility, which projects future volatility based on current options prices, historical volatility quantifies how much a security’s price has changed in the past. It is valuable for assessing the risk associated with a particular investment.
The importance of HV in options trading lies in its role as a benchmark. By comparing implied volatility vs. historical volatility, traders can gain insights into market sentiment. If IV is higher than HV, it suggests that the market expects more volatility in the future.
Furthermore, examining implied volatility historical data alongside historical stock volatility can provide a comprehensive view of a stock’s volatility trend.
Why Do IV and HV Matter for Options Traders?
Understanding the significance of implied volatility (IV) and historical volatility (HV) is paramount for options traders. These metrics play a crucial role in shaping trading strategies and investment decisions.
- Assessing Option Pricing: Options traders closely examine the relationship between IV and HV to identify overpriced or underpriced options. When the implied volatility exceeds historical volatility, it suggests that the options might be priced higher than what past price movements justify. Conversely, if IV is lower than HV, it could indicate potentially underpriced options.
- Mean Reversion Opportunities: Extreme disparities between IV and HV can present mean reversion opportunities. When IV reaches unusually high levels compared to HV, there’s a chance that the market has overreacted to recent events, creating the potential for a price correction back towards the mean.
- Playing Trends: By studying the interaction between IV and HV, option traders can discern trends in market sentiment. When IV and HV cross paths or move in specific patterns, traders may identify opportunities to capitalize on ongoing market trends.
In summary, IV and HV are invaluable tools for option traders. They enable traders to gauge option pricing relative to historical data, spot potential mean reversion scenarios, and identify trends in market sentiment. These insights are essential for crafting successful option trading strategies and making informed investment choices.
Implied Volatility vs. Realized Volatility
Implied volatility vs. historical volatility is an important concept to understand. IV and HV can provide valuable insights into market sentiment, allowing traders to make informed decisions.
Implied volatility (IV) predicts future price changes based on current options prices, reflecting market sentiment. Realized volatility (RV), also known as historical volatility (HV), measures past price changes in a security. Essentially, IV versus RV or HV represents market expectations versus actual results. Examining implied and historical volatility data together can enhance risk management and decision-making in stock trading.
IV vs. HV Backtesting Insights: Unveiling Behavioral Patterns
The exploration of implied volatility (IV) versus historical volatility (HV) uncovers intriguing insights when backtesting data is employed. Our analysis of implied volatility historical data dived deep into the interaction between IV and HV, providing an in-depth understanding of their dynamics.
Backtesting offers a robust method to evaluate these variables’ behavior under diverse market conditions. In our implied volatility backtest, we focused on both volatile and stable periods, comparing implied volatility vs. historical volatility performance during these times. The results revealed that both IV and HV are mean-reverting, a characteristic that greatly impacts trading strategies.
A key finding from the backtest was the similar conduct of the IV and RV ranks. High ranks indicated a decrease in the corresponding volatility and vice versa. This pattern was prevalent when comparing implied volatility vs. realized volatility (IV vs. RV), further demonstrating how interconnected these metrics can be.
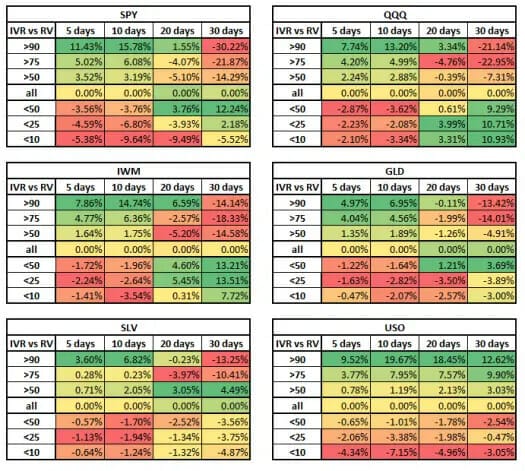
In addition, it was observed that when IV increased, RV also tended to climb for the subsequent two weeks before declining. Conversely, a decrease in IV led to a drop in RV over the next fortnight but a rise in the following 45 days.
The backtesting data underscored the significant influence of the RV percentile on future implied volatility. High RV percentiles led to a decrease in IV and vice versa, signifying the importance of understanding implied volatility historical data.
Implied Volatility vs. Historical Volatility: Impact on Options Trading
The world of options trading revolves around the concept of volatility, with implied volatility (IV) and historical volatility (HV) playing integral roles. The comparison between implied volatility vs. historical volatility offers a comprehensive understanding of potential risks and returns.
Implied volatility is a forward-looking measure, accounting for expected future volatility. It has a significant influence on option pricing due to its correlation with market uncertainty, as proven by implied volatility historical data.
Some strategies thrive in different IV environments. Buying options can be advantageous when IV is low, as this can provide cost-effective opportunities for potential price movements. Conversely, selling options, like covered calls or cash-secured puts, can be advantageous when IV is high, allowing traders to capitalize on elevated option premiums.
Historical volatility, in contrast, looks at past price fluctuations. It forms a crucial part of risk assessment in options trading. A thorough understanding of HV can help traders predict future volatility and adjust their strategies accordingly. For example, if a stock has a high HV, it indicates that the stock’s price has been volatile in the past, which could suggest potential future volatility.
The juxtaposition of implied volatility vs. historical volatility, or IV vs. HV, provides a holistic view of market dynamics. Traders can use this information to make informed decisions based on both anticipated future volatility (IV) and past price movements (HV).
Moreover, the interplay between implied volatility vs. realized volatility (IV vs. RV) further enriches this analysis. RV, calculated from underlying price changes, offers another perspective on past volatility, complementing the insights derived from IV and HV.
Real-World Applications and Case Study
Understanding the dynamics of implied volatility vs. historical volatility is crucial for successful options trading strategies. These two measures provide insights into market expectations and past price movements, respectively, and can help traders adjust their strategies based on changing conditions.
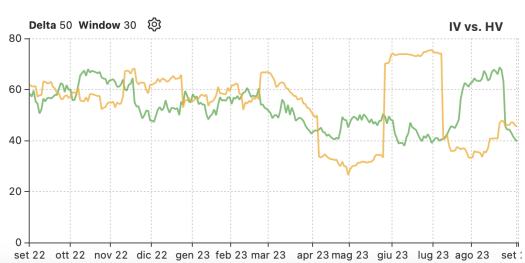
For instance, consider a recent NVDA stock option. A chart from Option Samurai shows the behavior of IV (in green) and HV (in orange) over time. Suppose the IV increases while the HV decreases. This scenario indicates that market participants expect future volatility to increase, even though NVDA’s historical stock volatility has decreased.
Here, an option screener can be employed to find ideal trades. The combination of IV and HV data can help traders select the most profitable options strategy for a given stock.
The analysis of implied volatility vs. historical volatility becomes even more nuanced when considering implied volatility vs. realized volatility (IV vs. RV). This comparison offers another perspective on past volatility, complementing the insights derived from IV and HV.
Implied Volatility vs. Historical Volatility: Debunking Myths
Before wrapping up, let’s look at some common myths to debunk when evaluating implied volatility vs. historical volatility:
- The concept of IV being strictly ‘overbought’ or ‘oversold’ may require additional analysis beyond considering IV levels alone when making trading decisions. It’s important to recognize that IV and HV are primarily determined by collective market expectations and historical price movements. However, traders may find it beneficial to complement their analysis with tools like Samurai’s IV rank, which translates IV values into statistical percentiles, providing a more comprehensive view of informed trading strategies.
- Discrepancies between IV and HV are often mistakenly attributed solely to market inefficiencies. External factors such as news events, earnings announcements, and macroeconomic developments significantly contribute to these discrepancies.
- IV and HV are not interchangeable. IV reflects market expectations (comparatively, implied volatility vs. realized volatility or IV vs. RV), while HV is based on historical price volatility. Recognizing this difference is vital for informed trading decisions.
Conclusion: Mastering Volatility for Informed Trading
Mastering the complexities of implied and historical volatility is fundamental to informed options trading. By integrating insights from both IV and HV into your strategies, you can navigate the markets more adeptly. Remember, options markets are dynamic and swiftly changing, calling for continual learning and strategic adaptation to flourish.

