‘Values on strikes’ are unique measures we created to help you find trades that take into account the underlying fundamental or technical situation at different strikes. Since options are contracts to buy and sell stocks at different prices, we measure the underlying parameters (such as PE, dividend yield, etc.) on those different prices to help you choose the optimal price.
In this article, we want to discuss a trade we’ve made during the COVID-19 crush and see how we quickly managed to find this low-risk trade (and you can, too). This trade is an example of how to use the dividend yield on strike filter:
KO Trade

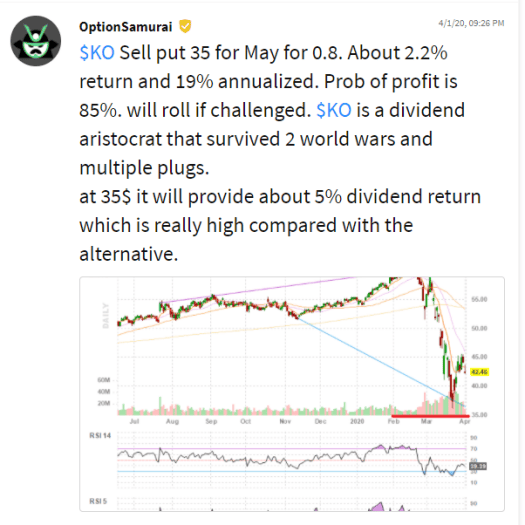
After finding this trade on our options screener, On April 1st, we sold naked puts on Coca-Cola ($KO) during a down day. Let’s analyze the trade a bit more closely:
Market environment: High fear and volatility. The outlook of most traders is bearish due to the uncertainty and scary nature of a pandemic.
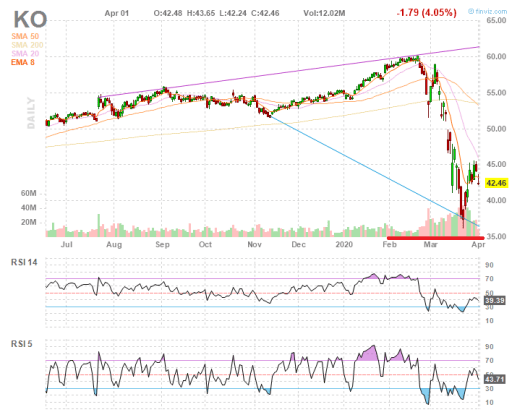
Company technicals: $KO was technically bearish as it dropped with the rest of the market and is currently trying to correct the unprecedented drop.
Company fundamentals: The company business is solid but has long-term problems due to eating healthier trends. The company is aware of it and takes action to fix it. However, The business is still excellent, and the right price is probably one of the best in the world.
Dividend policy: The company is one of the ‘dividend aristocrats’: Companies that INCREASED dividends every year for at least 25 years. The dividend yield on strike was over 5% – meaning that if assigned and we purchase the shares, the company will pay a dividend of 5% per annum (and we can also sell covered calls). At the current price, the yield was about 3.8%. This means that it is a relatively low-risk trade.
Trade: We sold out-the-money put with a 2.2% unleveraged return, which was almost 20% annualized. We had an 85% probability of profit, and in our mind, it is a low-risk trade as the dividend policy offered us a kind of ‘floor.’
Overall: This trade was a low-risk trade that allowed us to get a good return with a high probability. If assigned, we would hold a reliable company that has proven the ability to navigate down-turns with an excellent dividend policy. Low-risk-High-Reward trade. Only possible due to the fears and the unique situation in the market.
How it ended: The company was around those prices the next day, but after that, it moved higher and didn’t revisit these price levels. The trade has been profitable since its initiation.
How to manage the trade: Sometimes, the trade goes against us. However, trading on a stock with a stable dividend policy that gives a high dividend compared to the interest rate gives us a few options. If the stock falls below the sold strike, we can:
- Buy the stock, and sell covered calls: This is also called a ‘wheel strategy.’ Since we now own the stock, we enjoy the dividend. And with selling OTM calls, we can have two income streams.
- Roll the put: We can roll the put, usually for a strike lower and additional premium. Thus, we are lowering the cost basis even further.
- Roll the put and buy an OTM call: This is a higher-risk strategy and effective if we are very bullish on the stock. We turn our trade to a risk reversal, and if the stock returns to previous price levels, we will enjoy higher profits.
How you can use it
While the trade on $KO was rare and probably happens every few years. The framework of using a stable dividend as a kind of support can be used regularly. Just a few months ago, we saw financials and oil companies in that situation, and those trades would have been very profitable as well (we shared a few examples in our Stocktwits).
You can use the dividend on strike in your scans or use our predefined scan as a template. If you want, you can see How to use the scanner to find dividend-capture opportunities.
.
The plan is to slowly enter diversified positions in different assets that have confirming signals (for example, strong fundamentals and dividend yield).


Enjoyed reading this article.
With your “wheel strategy”, selling OTM CCs provides 3 potential income streams (capital appreciation, dividend income, and Call options income).
Regarding your use of RSI(5), other than the convenience of arbitrarily picking one week (i.e. 5 trading days), are you aware of any reliable resources that have statistically studied/simulated the number of trading days (e.g. RSI(1), RSI(2), … RSI(10) days)?
Your reply would be appreciated. Thank you. Jeff
Thanks, Jeff!
In my scans, I usually use the 14 days RSI just because it is widely accepted. I also ran an RSI 14 backtest few posts ago and published the results. The RSI 5 is something I felt comfortable with in the past. I also ran backtest manually to confirm that. I can tell you that with the years the results changed, and it doesn’t behave as it used to in the past. However, I’m still used to RSI5 so I have it on my charts as well 🙂
When I look at it, I assume it will be OS or OB for long periods of time and I’m more interested in the duration in OS/OB zones.
The problem with running an RSI 1-100 backtest is that it is very easy to curve-fit and get an RSI that was great in the past, but not anymore. I do plan to run an adaptive RSI backtest in the future, but I still didn’t get to it 🙂 if there will be interest I will publish the results when I get to it.