
May has started, and we are happy to announce our new version. This month we’ve continued to improve our stock scenario model (launched last month) and added new capabilities.
This month’s features:
- Predefined scans in the stock scenario: This feature will allow you to see all the predefined scans that the stock appears in to help you get trade ideas on your selected stock.
- Expected P/L: We’ve improved our P/L calculation. Before, we did a simple calculation about what will be the PL on the selected point, and now we have a Monte Carlo simulation that simulates all possible combinations and finds the highest EXPECTED P/L between all the strategies. The slider has been improved as well. Read more in our blog.
- Predefined scenarios: This will help you start your stock analysis quickly by picking the expected behavior from a list of popular scenarios to check.
- Bug Fixes and improvements – We’ve continued to deliver improvements and bug fixes according to your feedback.
Predefined scans in the stock scenario
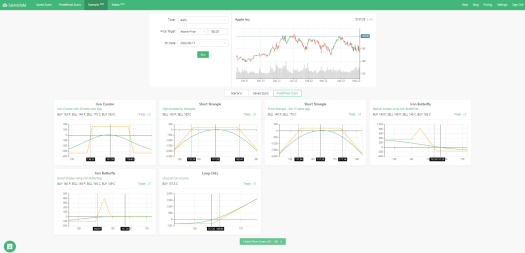
After you’ve added the ticker you are interested in, you can click the predefined tab and see what predefined scans include the symbol you’ve just entered. This can help you get ideas for possible trades and help you analyze the stock you’ve entered to have more information.
Expected P/L
We’ve improved the Profit&Loss calculation in our scenario engine. Before the change, we’ve shown the strategy’s profit in the range, so if you asked for a range above the strike of $100, we showed the payoff at $100. The new calculation uses Monte Carlo simulation to check the AVERAGE profit&Loss in the specified range. To do that, we run 50,000 random simulations of the stock using the strategy volatility and risk-free rate. Once we have 50,000 random paths of the stock, we calculate the P&L of each combination and possible option trade and generate the average profit and loss of only the simulations inside the range you specified.
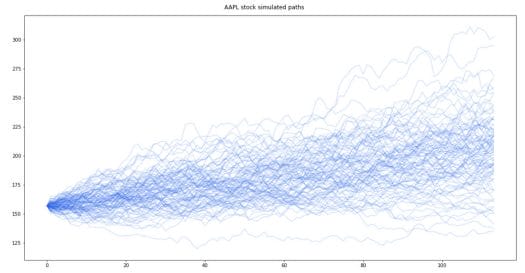
This allows for better comparison between different strategies and gives a more interesting and unique data point. You can still see the P&L of the trade if you hover over the chart in the graph.
We will publish an in-depth article about calculating expected P/L in the future.
Predefined scenarios
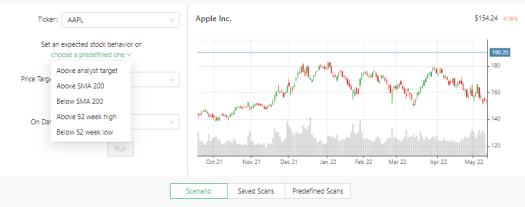
Predefined scenarios allow you to start analyzing stocks quickly by picking from a list of popular scenarios to check. For example, you can check the best strategy if the stock arrives at its analyst target or to its 52w low.
Bug Fixes and improvements
We’ve continued to deliver improvements and bug fixes according to your feedback.
The version is now live and available to use.

