In this post, I wish to talk about lowering the cost basis of a position. I will do that by showing a trade that didn’t go so well but still showed a profit because I managed to lower my cost basis. It is important to note that this post is not about the tax definition of cost basis but rather the practical implications of reducing cost basis over the long-term.
Reducing cost basis is an integral part of long-term options investing, and it is the base of the ‘option wheel’ strategy (a strategy where we sell put and if we are assigned, we sell covered calls until the shares are called again).
How do we Lower the Cost Basis?
Lowering the cost basis is done by selling options premium and collecting it as it expires worthless. We can also reduce the cost basis by collecting dividends or timing the market, and increasing our positions when the market corrects.
Here are some examples:
- Use market correction to increase position – buying stock XYZ @ $100, then when it goes to $90, double your position. If the stock goes back to 100$, you own twice the amount with a cost basis of $95.
- Dividends – If you bought stock XYZ for $100 and then it distributes a $5 dividend. We can say that the new cost basis is $95.
- Selling options – If you bought stock XYZ for $100 and then sold OTM call for 5$, and it expires worthless. The new cost basis is $95.
These are just high-level examples of how to lower cost basis and increase your probability of profiting. While we can’t control the stock volatility, we can buy stocks that distribute dividends. If the dividend is steady, it increases your chance of profiting in the trade. You can then sell options to generate cash flow that will lower the cost basis even more. Samurai has universes and dividend filters that allows you only to scan trades on assets with dividends).
Lowering cost basis with options – An example
Since lowering the cost basis requires several rolls and takes time, it is tough to see and “feel” the effect of the cash flow we expect to generate over the trade’s life. This is why we will analyze an example and hopefully will make the mechanism more visible. We will use a trade that went wrong to show that the cash flow is very powerful and helps you profit even if you make mistakes.
.
BX – Blackstone Group
Blackstone is a publicly owned investment manager that manages money, ETFs, funds and provides financial advice to its clients. It’s a massive company with a market cap of >40B$.
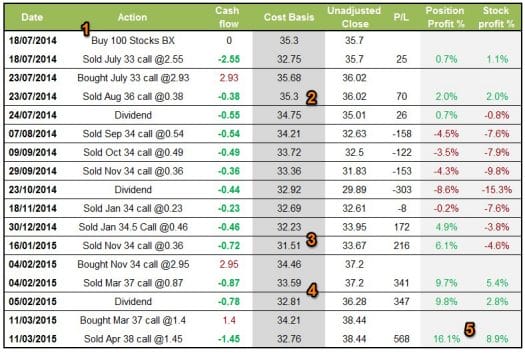
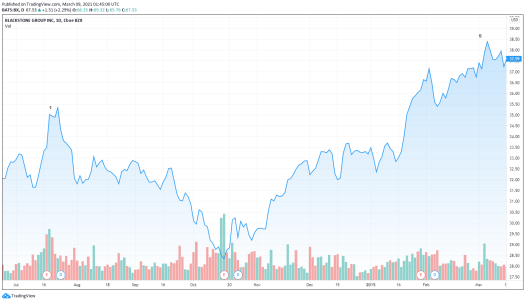
I started my position on 18-July 2014 when the stock appeared on my dividend capture screen. Later, I decided that I don’t want to sell the stock, so I rolled the call out of the money to avoid being assigned. Soon after, the stock crashed more than 25%;
These are the trades I did on BX:

- Entered the position with ITM covered call for a week (tried to capture the dividend a week later)
- A day before Ex-dividend, I rolled the call out. Luckily, I kept the same cost basis but lost when considering commissions.
- Soon after the dividend, the stock plummeted. I started selling OTM calls. You can see that from beginning at a cost basis of 35.3 in July, with dividends and selling calls; I managed to decrease my cost basis to $31.51 in Jan 2015 – an 11% decrease in 6 months.
- As the stock rose in Feb-Mar, I started to roll the call out. I had to buy them at a loss and thus increased my cost basis.
- Even though my trades weren’t perfect, you can see that selling covered calls managed to increase my profits compared with plain-vanilla stock position (and will the same risk).
For visual aid, This is the stock chart:

Key Takeaways
- Even though my trades were not perfect, I managed to increase my profits: 16% instead of 9% for a straight stock position.
- Often I see traders that are wary that covered calls limit the upside. You can see that it’s true, but the benefits outweigh the disadvantages over the long run.
- Dividends and calls create strong cashflow from a stock position. You can profit even if the stock is range-bound.
- Even if a trade went against you, if you believe in the company, slowly decrease your cost basis, and when the stock rises, you will increase your profits.
- It is important to remember that not all stocks are suitable for this strategy. I wouldn’t use it when the stock is known to gap, or the story of the company is all or nothing (like biotech stocks). Other strategies will better suit these stocks.
Try Option Samurai for FREE
(This article was originally written in March 2015, and updated since)


[…] Lowering cost basis example with dividend and covered calls […]
I was put with roku shares and am underwater on them quite a bit. my cost basis is 353, after puts and 1 cc contract. I was thinking about selling the 500 shares and then selling a 355 put 11/29 for 40 dollars on 500 shares. cost basis would be now 315 and would bring in 20000 in premium. I’m under water 18000. is this crazy? No where do i find anything about this strategy. If I get put again lower cost basis could mean better cc’s or rinse and repeat at a lower price. thanks, Am I crazy?
Hey David,
If I understood correctly, you want to sell more shares than you hold, and effectively turn into an ITM covered put, where you are short Roku + sell puts for premium.
The main problem: This is a bearish strategy. So you turn a bullish strategy (naked put/ cc) into a bearish one. If you are doing it because you are underwater it is the wrong reason… I would ask – If you didn’t have a position now. Would you initiate a bearish trade on ROKU?
I wouldn’t. And I think you wouldn’t as well. Also, we are still in a bull market, so a bearish trade is even riskier. And while ROKU is expensive, why out of all expensive stocks, pick ROKU for short?
(another risk of a covered put is the funding rate for short stocks. but it’s smaller).
I know it is frustrating to be underwater in a bull market. But if you still bullish on ROKU and you have enough buying power to also initiate other trades, it might be a good idea to continue to selling calls to reduce the cost basis until you have a better opportunity to exit.
Hope it helps.
I’m not understanding your spreadsheet calc on P/LPosition, Profit %, Stock Profit %. If you can attach the spreadsheet or email it that will be great.
Hey Vin, I’m sorry. I can’t find the Excel.
The PL is the profit and loss of the position, in $ value fo 1 unit (i.E 100 shares + 1 call). The profit % is when compared to the amount invested (100shares – call) and the stock profit % is just the change in stock price.