The options market provides several opportunities to generate revenue depending on the strategy that best suits your trading needs. One of the most popular ways to trade the options market is to look for directional plays, where you anticipate the trend, using a combination of tools. Options provide you with a great way to speculate on the direction of a stock or ETF, but to do this you must understand when option valuations are rich or cheap. By combining inexpensive option premiums, with momentum and trend following indicators, you can generate a directional play where the risk you take is well worth the reward you can receive.
Some Theory
It’s important to remember when trading options that the price of an option is based on the probability that a stock or ETF will be in the money on or before the expiration date. The probability of an option expiring “in the money” is predicated on the implied volatility that is used to price an option. Recall, implied volatility is the markets estimate of how much a security will move from current levels over the course of a specific period on an annualized basis. For example, an implied volatility reading of 12%, means that option traders believe a security will move 12% from the current level over the course of the next 12-months.
You could purchase a call, when implied volatility is in the lower 95% of its historical range, generating a low-cost high reward trade
Finding a Trade Using Option Samurai
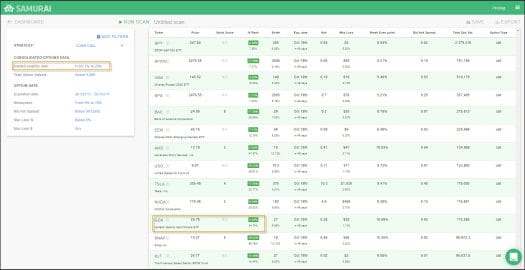
If you are looking to take a directional bet were a security will move higher or lower and want to cap your risk with an option were the most you can lose is the premium, you can purchase a call or put option. When you are purchasing a call or a put, you want to find scenarios where the market believes the probability that the security will be in the money at expiration is low. This would mean that the option premium is relatively cheap and this occurs when implied volatility is relatively low. By using the Option Samurai scanner, you can search for situations where the current implied volatility of a security is in the bottom end of a historical range.

- Use our Options Screener to find trade opportunities like this.
By scanning for options that are in the bottom 20% of a recent historical range, where the maximum loss is less than 5%, you can find stocks or ETFs were the implied volatility is inexpensive. The IV Rank column, shows you the range of the Option Samurai implied volatility index based on a scale from 1% to 100%. Levels less than 20%, are in the bottom 5th of the historical range.
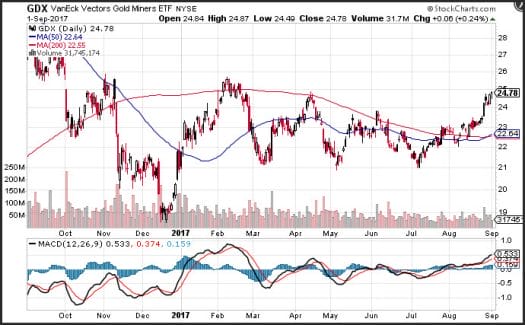
Once you have found a stock or ETF that meets these criteria you can then evaluate a chart to determine if the stock price is likely to experience momentum, that is currently not priced into the options market. You can use any method to do that. In this case, let’s see a technical chart of GDX:

The chart of the GDX ETF (VanEck Gold Miners) is poised to break out to 5-month highs. The 20-day moving average has crossed above the 50-day moving average which means that a medium-term trend is in place. Additionally, the MACD (moving average convergence divergence) index recently generated a crossover buy signal. Which means that positive momentum is accelerating. With geopolitical events continuing to generate a safe-haven bid for gold miners, this concept has some merit.
If you purchased a call on the GDX: Strike 27 for October the maximum loss is $28 per contract (Max loss of 1.3% compared with a regular stock position), and the option has robust volume with a very tight bid offer spread. By purchasing an “out of the money” option, using criteria based on “moneyness” on the scanner, you can reduce your premium outlay. You could purchase a call, when implied volatility is in the lower 95% of its historical range, generating a low-cost high-reward trade.
- See an example of an old IBM trade we’ve made.
- Read our guide about how to be more successful when buying options.
Click here to go to Option Samurai scanner and find similar trades instantly.

