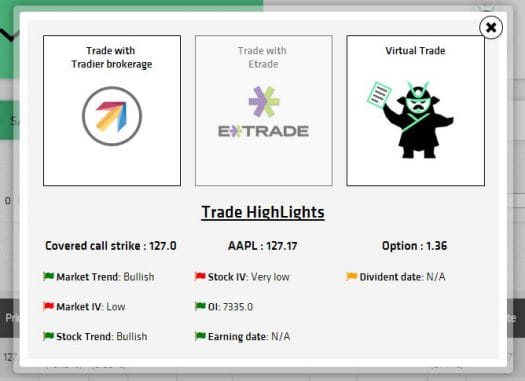
The “trade highlights” feature is designed to give you an overview of the most important data for the selected trade. This is important because it saves you time and helps you verify the trade strengths and weaknesses before sending them to the broker. The visual design makes it easy to analyse the trade in seconds.
Trade Highlights:

- Market trend – Based on our market sentiment widget. Will show a green flag when the strategy’s tendency is inline with the market trend, and red if it’s the opposite. For example: If the market is bullish the flag will be green if strategy is covered call and red if strategy is long put.
- Market IV – Similar to the previous item. Will show a green flag if the market condition is inline with the strategy. For example – If the IV is high it will show a green flag for covered call strategies and red flag for married put strategies.
- Stock Trend – Identical to the market trend, but measures the stock trend using moving averages.
- Stock IV – Identical to the market IV, but measures the stock IV.
- OI – Open Interests – This helps verify the liquidity of the option contract chosen.
- Earning date and Dividend date
It is important to emphasize that the check list is not designed to trade the “perfect” (all green) trade. But to help you notice the trade strengths and weaknesses quickly.
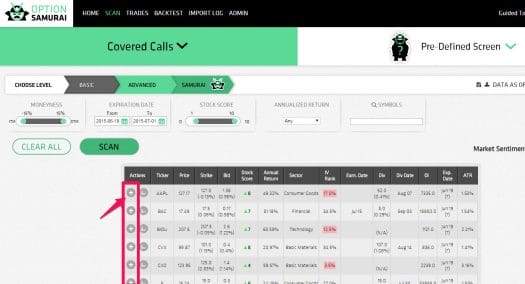
To see the trade highlights simply press the “+” sign next to the trade you like:

Try Option Samurai:


