In the last article, Volatility Skew Rank – Part 1, we talked about what skew is. In this article, we will talk about ranking the volatility skew rank and its edge in the market.
Volatility Skew Rank
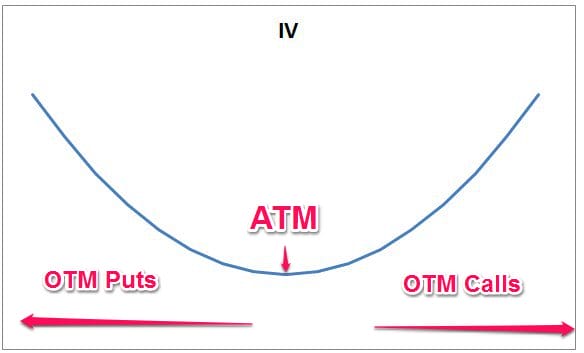
As discussed in the previous article – Skew measures the ‘slant’ of the IV smile. While it can indicate a bullish or a bearish tendency, you can only learn this if you compare the current value to the past skew values.
To simplify that process, we rank the skew over the last year. That ranking process standardizes the skew to values between 0-100 and allows you to understand the current state of the skew in a glance:
- The lower the number (closer to 0), the more bullish the skew is.
- The higher the number (closer to 100), the more bearish the skew is.
- If the volatility skew rank is 97%, for example, it means that the current skew value is higher than 97% of the skew values over the last 200 days (almost a year). Which means it is high.
Benefits of the volatility skew rank
Because of the ranking of the skew, you can easily see at a glance if the options are pricing a bullish or a bearish move. Furthermore:
- Skew standardization allows you to compare different stocks – for example, competitors and see the option-market opinion on them. This can help you find a strong company or a weak company.
- The standardization allows you to see the stock’s historical skew very easily (we will discuss the edge in the next section).
- This will allow you more insight into the option pricing and decide which strategy is best to use at the moment.
The edge of the volatility skew rank
To measure the edge given by the skew rank, we measured the Skew on the S&P 500.
Skew change X days after a Skew-Rank:
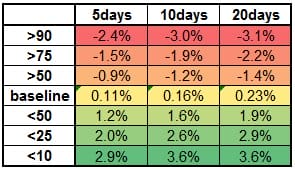
The following tables explain the change X days after a certain percentile. For example:
- We can see that the skew (on average) increased by 2.9% in 5 days after the skew rank was under 10 (low).
- We can see that the skew (on average) decreased by 3.1% in 20 days after the rank was greater than 90 (high).
- We can compare these to the baseline of the sample – which was rather positioned but close to 0 during that time.
- We also learn that there isn’t much use in waiting to the 20 days vs 10 days.
$SPY change X days after a skew-rank:
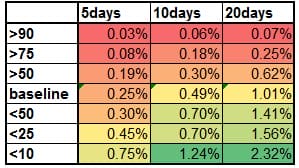
When looking at the volatility skew rank vs The future performance of the S&P (measured by SPY), we can see:
- On average, the SPY has risen in the sample.
- We can see that the SR (Skew rank) gives an edge of about 1% on the upside (in 20 days) and 1% on the downside.
- The edge is not enough to initiate a trade directly, but it can help with understanding the sentiment of the market. It can also help in timing the trades you were already looking to take.
Learn more about the IV Percentile in our guide and the Difference between IV Rank & IV Percentile.
Summary
Volatility skew rank allows you to easily compare the current skew to the historical skew of that symbol. This provides you with an understanding of the option market bias:
- If the rank is low, it means that calls are priced relatively high, and the market is bullish.
- If the rank is high it means that the puts are priced relatively high and the market is bearish.
In most cases, the option market predicts the future move of the market (so, for example, if puts are expensive – the markets will probably go down), but there are two important caveats: (1) The market often overshoots the real results and (2) even if the market move down, there are still ways to profits from decrease in IV in the options.
We can see that the rank is high – we can predict that the market will be more bearish and that the puts will become less expensive compared with the calls. And vise versa – if the rank is low.
When we know that, we can think about how best to play these situations: ratio spreads, sell OTM options, risk reversals, and more.
Go to Option Samurai

