As part of our premium plan, we send our users a weekly sector report. This report analyzes all sectors of the market from a bird’s-eye view. It measures the current distance of each sector from the ‘normal’ range – and highlights sectors that are in over-bought / over-sold and present a quantitative edge for entering. We use this report for two main reasons:
- Highlighting the interesting sectors in the market. This allows us to find trade ideas in those sectors
- Gain confidence in our trades using a quantitative measure for expected out-performance, based on past events.
In this post we will give an example on how to use this report from start to finish. The goal is to learn how to integrate this report in your trading.
Weekly MA Report
This report is generated each week based on each sector’s ETF. We measure the distance of each ETF from it’s 200 days moving average. This value is then compared to the past year, which gives its percentile. This means that we know for every distance, how it compares to the behavior in the last year. We then backtest to see how the ETF behaved after that event and compare to regular conditions.
The normal behavior of the sector is to move from over-sold to over-bought conditions and vise verse. We try to time our entry to profit the most from those movements.
Let’s use an example to gain better understanding:
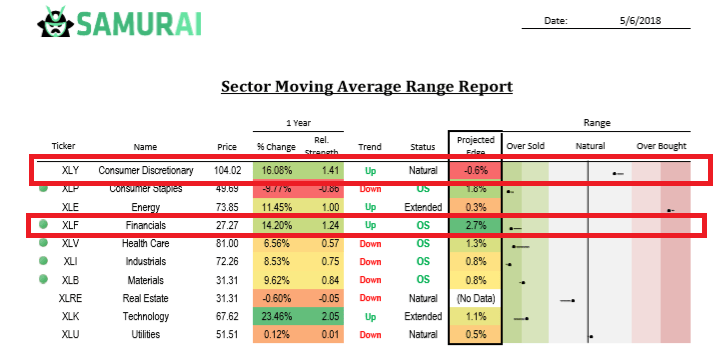
In this Example we will focus on the XLY and XLF rows. We will not go in-depth to each column as it is explained in detail in our FAQ section here.
When we look at the XLF sector, We can see that it is in an up trend and it is in an over-sold condition. This means we should look for a bullish trade. When we look at the column projected edge we see 2.7%. From this we can expect XLF to outperform the normal behavior by 2.7%.
From this we can learn the expected return for an over sold condition: If the normal return of the XLF in the last 5 years is X% a month, then in this case, for an over sold condition (like at the date of the report), we can expect the following month return to be X+2.7%.
Now let’s look at the XLY sector: here we see that it is in an up trend, but the status is natural. past events lead us to believe that the current edge is negative -0.6%, which means that if the monthly return in the past 5 years was X%, we can expect X-0.6% for the next month. This implies that this sector has less of a technical edge in this and we should look at different sectors.
As you can see, using this report can help us focus on sectors with more edge in them. We can then trade the ETFs directly or use Samurai to find trades in those sectors.
- Read here about how to scan using sectors
- Read here about how to scan using custom symbol list
Example Trade
On April 22nd we released a report to our users. In this report we saw several over-sold sectors, but XLP, XLK and XLF showed the greatest upside edge.
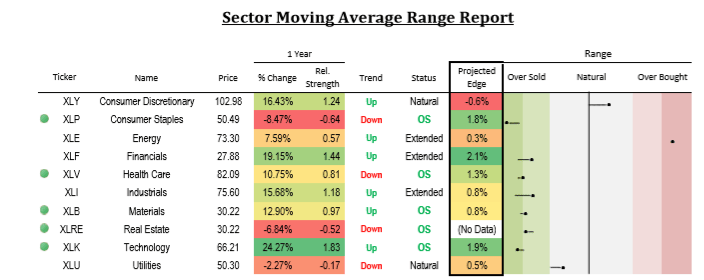
When I looked at the different ETFs, I preferred the formation in XLP over the formation in XLF as the latter already started its move. I felt that XLP would be safer bet. I also had several trades in the XLK sector (You can see in our Stocktwits account) so I wanted to diversify. I chose to look more in-depth in the XLP sector.
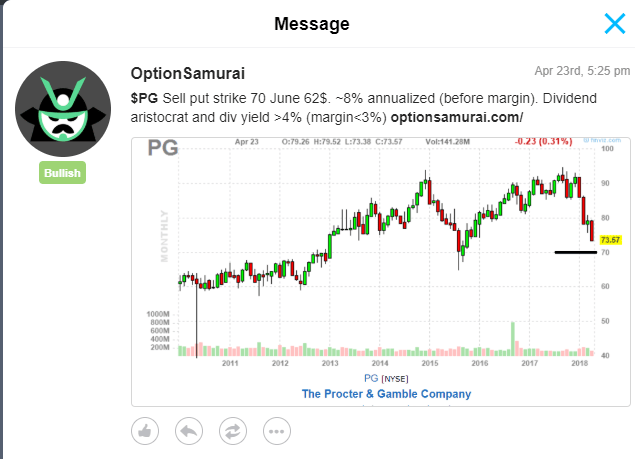
I ran Samurai option scanner and found a trade I liked on $PG (See here)
The reasons for the trade:
- There was a quantitative edge in the sector, and since stocks in sectors are highly correlated. I wanted to enjoy the edge while holding an individual name.
- P&G is a dividend aristocrat – in the last 25 years not only it distribute dividend every year, the amount has risen every year. The current dividend yield is 3.8% and expected to rise.
- support on 68-70 levels. The stock kept above those levels for more than 5 years.
- Selling put on $70 gives me another 5% margin of safety (and it already dropped almost 20% from the $90s level it was previously) .
- Margin efficiency: At the prices I executed I got about 8% annualized return un-leveraged. Assuming I need toallocate 2000$ as margin (currently the margin requirements are less than 800$) the return will be 24% annualized.
At the moment I’m publishing this article, the trade is still open, we are above the 70 strike, but the trade is losing as the stock continued down a bit more. I’m still holding this trade as time works for me and I have 3 options going forward:
- If I’m aggressive and the stock continues down, I can open another naked put on a lower strike.
- I can wait closer to expiration and then roll the option down and out in time. Usually I can do it without taking a loss.
- If the stock will be under 70 at expiration I can buy the 100 shares, and start selling calls above the market. I’d then enjoy the call premium and the dividend cash-flows.
Summary and tips going forward
In this article I described how I used the Moving Average report and gave an example to help you integrate it in your trading. Here are some more tips:
- The sectors move from over-bought to over-sold. We need to be patient and time our entries. We will always find another idea in the future.
- I always look for another confirmation for my trade. In the $PG trade example above I had the (1) technical sector edge, (2) Fundamental strength and (3) technical support on $70. It is always good to have another confirmation from macro, technical, fundamental, volatility etc on your side as well.
- The sectors move in groups. It is very good to take note of two characteristics: (1) the strongest moving sector and (2) the sectors that are not part of the group. These sectors will be prime candidates to trade: the strongest sector if you want to trade in the direction and the outlier if you expect a reversal in the market.
- Be mindful of the large market mechanic. If we are in a sideways move (like today) it is better to enter contrarian trades. If the market is trending we might want to be faster to enter.
- If you expect a strong move -> look at debit strategies (like buying options) as usually they will offer a limited risk and unlimited reward. If the market is choppy and you can have a reasonable stop-loss – sell options as they have higher profit probability. It is best to mix those strategies in your portfolio to have more diversification.
Check out the scanner here to start your free trial:

