This is the second part in the series about the edge of the market sentiment. The first part about relative strength edge was published a few weeks ago.
In this part I wish to describe a simple mechanism for Trend following – Moving Average.
Moving average quantitative edge
A moving average is an average that calculated continuously for the last N occurrences, each new points removes the oldest point. The moving average serves as an adjustable “noise” filter and has many variations that try to make it more adaptable to real moves while still ignoring the market noise. The edge of the moving average is well known and many conducted tests about it and some described how to use it in a trading system( Meb Faber blog and Ivy portfolio). While I don’t think you should use this indicator as-is in a system, you can enjoy the characteristics of this mechanism.
Moving Average edge
For this post, we conducted a backtest and took the last 1000 trading days and checked the effect of the moving averages have on 3 top wide market ETFs (SPY, QQQ, IWM). The results are below:
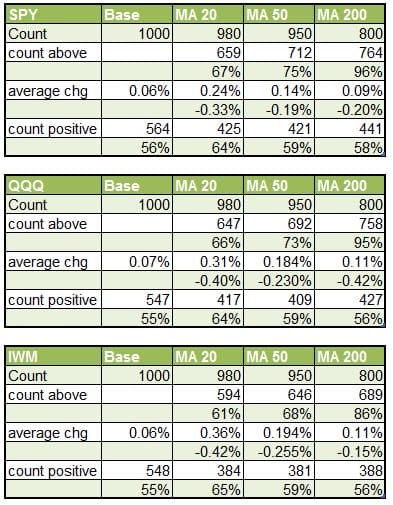
*MA is Moving Average and the number says how many days (MA 200 is moving average 200 days)
How to read the table:
- The count line represents how many trading days are in the sample.
- Count above measures how many days the close price was above the average.
- Average change is the daily average change of the ETF when it was above. The row below is the daily average change when the ETF was below the average.
- Count positive is the number of positive days that we saw when the ETF was above the MA.
For example: If we check the S&P 500 – Wen it was above MA 200 – it had 58% up days and 0.09% average daily move.
As you can see, for each ETF and each time frame, when the market is above the MA we see a bullish tendency – both in size of moves and number of up days.
We can see similar tendency (bullish above MA) in stocks as well. This is not uprising and those ETFs are comprised of those stocks.
summary
To conclude, The Moving average is a trend indicator that helps us determine the bullish tendency of the market – when last price is above the average. The same goes for the opposite: when market is below its average – the trend and tendency is bearish.
We don’t recommend to use this as-is in a system as it gives many false signals. However, using it in conjunction with other indicators might prove more profitable.
The main power of this indicator is with it’s simplicity – it is wide spread and easy to calculate. This means it is easy to incorporate it with your trading flow and capitalize on that edge. And the edge is apparent and across many assets, countries and time.
We are now working on developing an engine that will give you sound statistical insights and allow you to validate entry and exit signals and patterns in the options market. At the mean time you can enjoy the insights we generate from this tool.


[…] look into the various edges traders base their decision making . You can read the previous part here and all of the series here. This methods are based on quantitative systems built from several […]