
Over the last couple of months, we have been re-writing our backend and frontend code. We’ve changed the technology stack and made it possible to launch features much faster. Now it is time to reap the reward, and we have started to launch many new features at a fast paste: A month ago, we launched mobile support (see release notes), and 2 weeks ago, we added more data and Short Straddle strategy (see release notes). Now we’re happy to announce that we have added another new strategy, a comparison between IV and HV (Implied Volatility Vs. Historical Volatility) and more requested improvement. Continue reading to learn more:
Short Strangles:
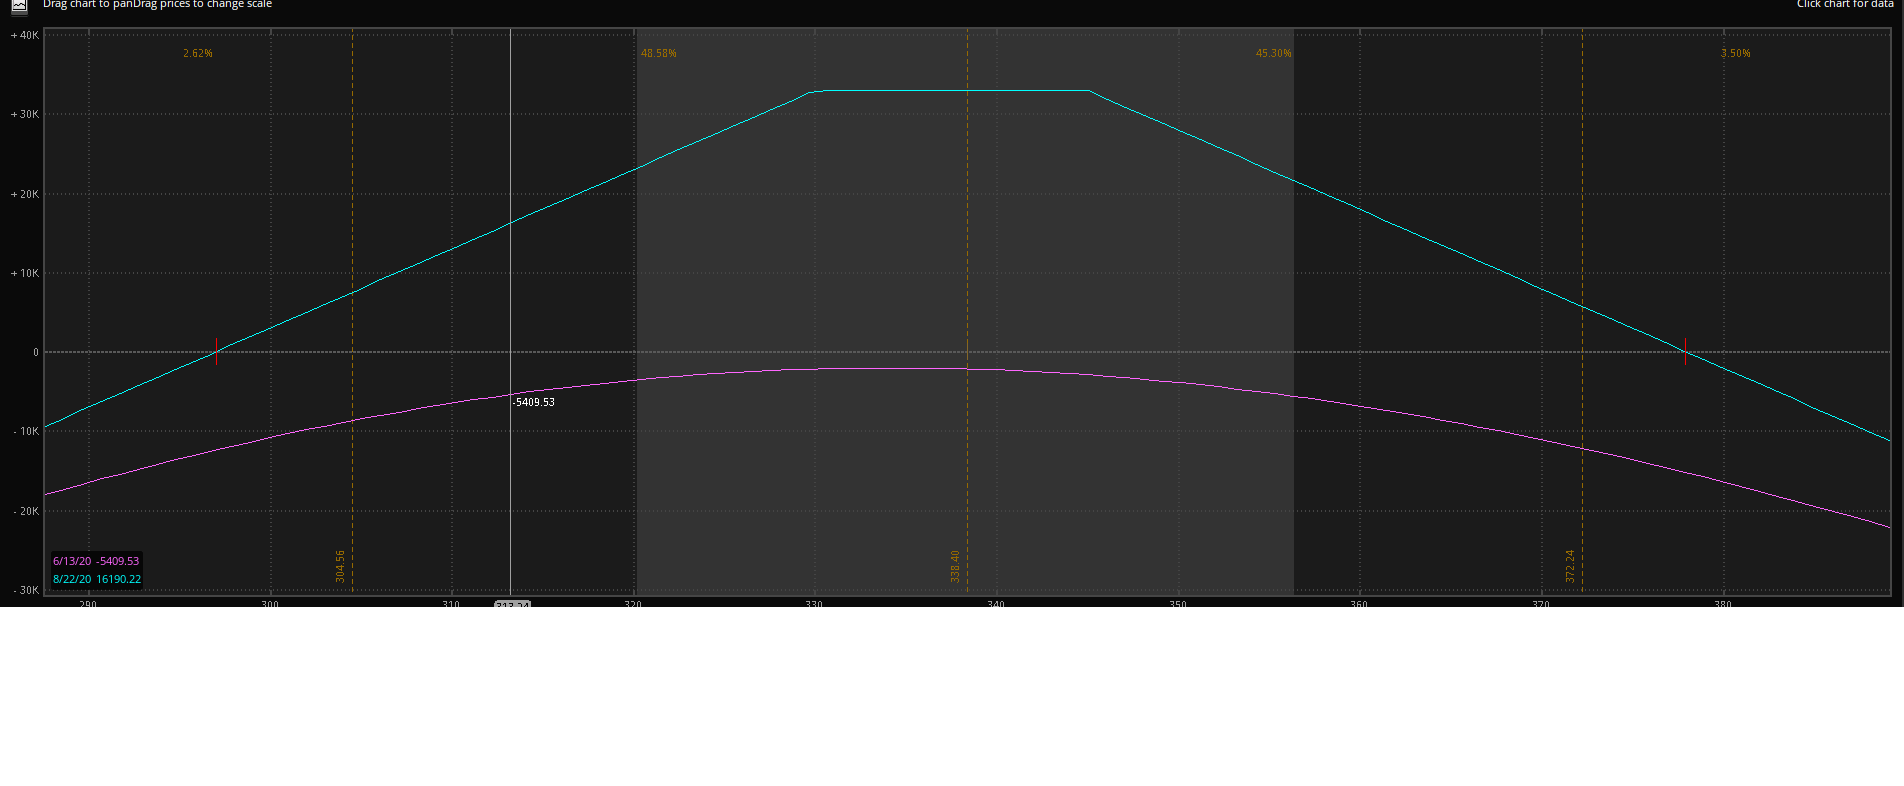
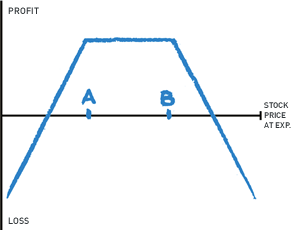
Strangle is an options strategy that comprised of selling Out-The-Money call and put for the same expiration. It is best if you want to profit from a decrease in volatility, and you believe the asset will remain range-bound. You can determine the probability of profit, and the distance of the legs in both % and ATR (Average True Range).
Implied Volatility Vs. Historical Volatility
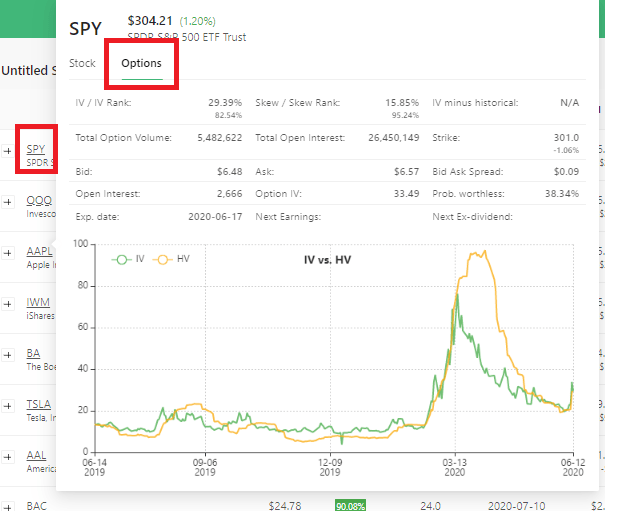
We are happy to announce we added another vital way to analyze options pricing and understand if they are overvalued or undervalued. We’ve added several data points that compared the stock Implied Volatility (IV) to Realized Volatility (or Historical – known as RV or HV).
Data points added:
- IV – RV: This measure is calculated: Implied Volatility minus Realized Volatility. If the result is above 0 -> Implied Vol is higher. If the result is below 0 -> Realized volatility is higher.
- IV – RV Percentile: This compares the IV-RV data point to itself over the last year. It is bound between 0-100, and it is mean-reverting. A value of 90, for example, means that the current IV-RV is greater than 90% of the values over the past year. As mentioned, this value is mean-reverting, so if the value is high, we can expect it to go lower and vise versa.
- IV – RV Chart: This chart shows the IV – RV over the past year. To see it for each stock, press on the ticker, and on the popup window, pick the ‘options’ tab.
- Volatility Score: This score is the average of the IV-RV percentile and the IV percentile and is used to discover options that are overvalued or undervalued.
Unusual Intraday Options Volume
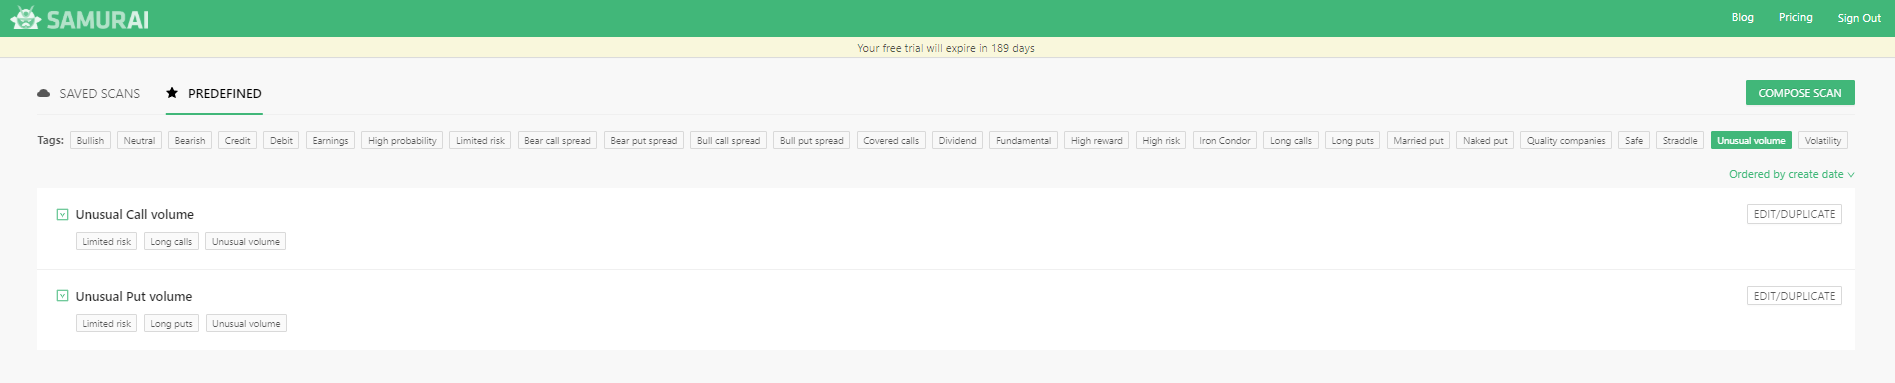
We’ve added unusual options volume scans to the predefined list to help users find what the smart money is trading faster and easier. We are calculating this constantly throughout the day, and we compare the intraday option volume to the Open Interest (OI).
Sorting in Dashboard:
We’ve added the ability to sort the predefined list and your saved scans according to date or name. We also allow you to sort the results from the dashboard without the need to go to the edit scan page.
Bug Fixes and General Improvements
We continued to solve some bugs and requests to make the platform better.
As always – feel free to contact us with any request or idea.


[…] our latest version, we’ve added two predefined scans that will help you get started trading unusual options […]