This is the first post, describing our unique options backtester. Our options backtester allows the user to set up an event, and then see the behavior of stocks and/or options after that event.
For example, You can test:
- What happened to a Risk reversal when Skew was low or high?
- Should you buy a straddle when Implied volatility is extremely low?
- What is the best options strategy to use if you think the $AAPL is going up and IV is also going up
- And many more.
This post will provide a quick introduction into the option backtester tool.
The options Backtester
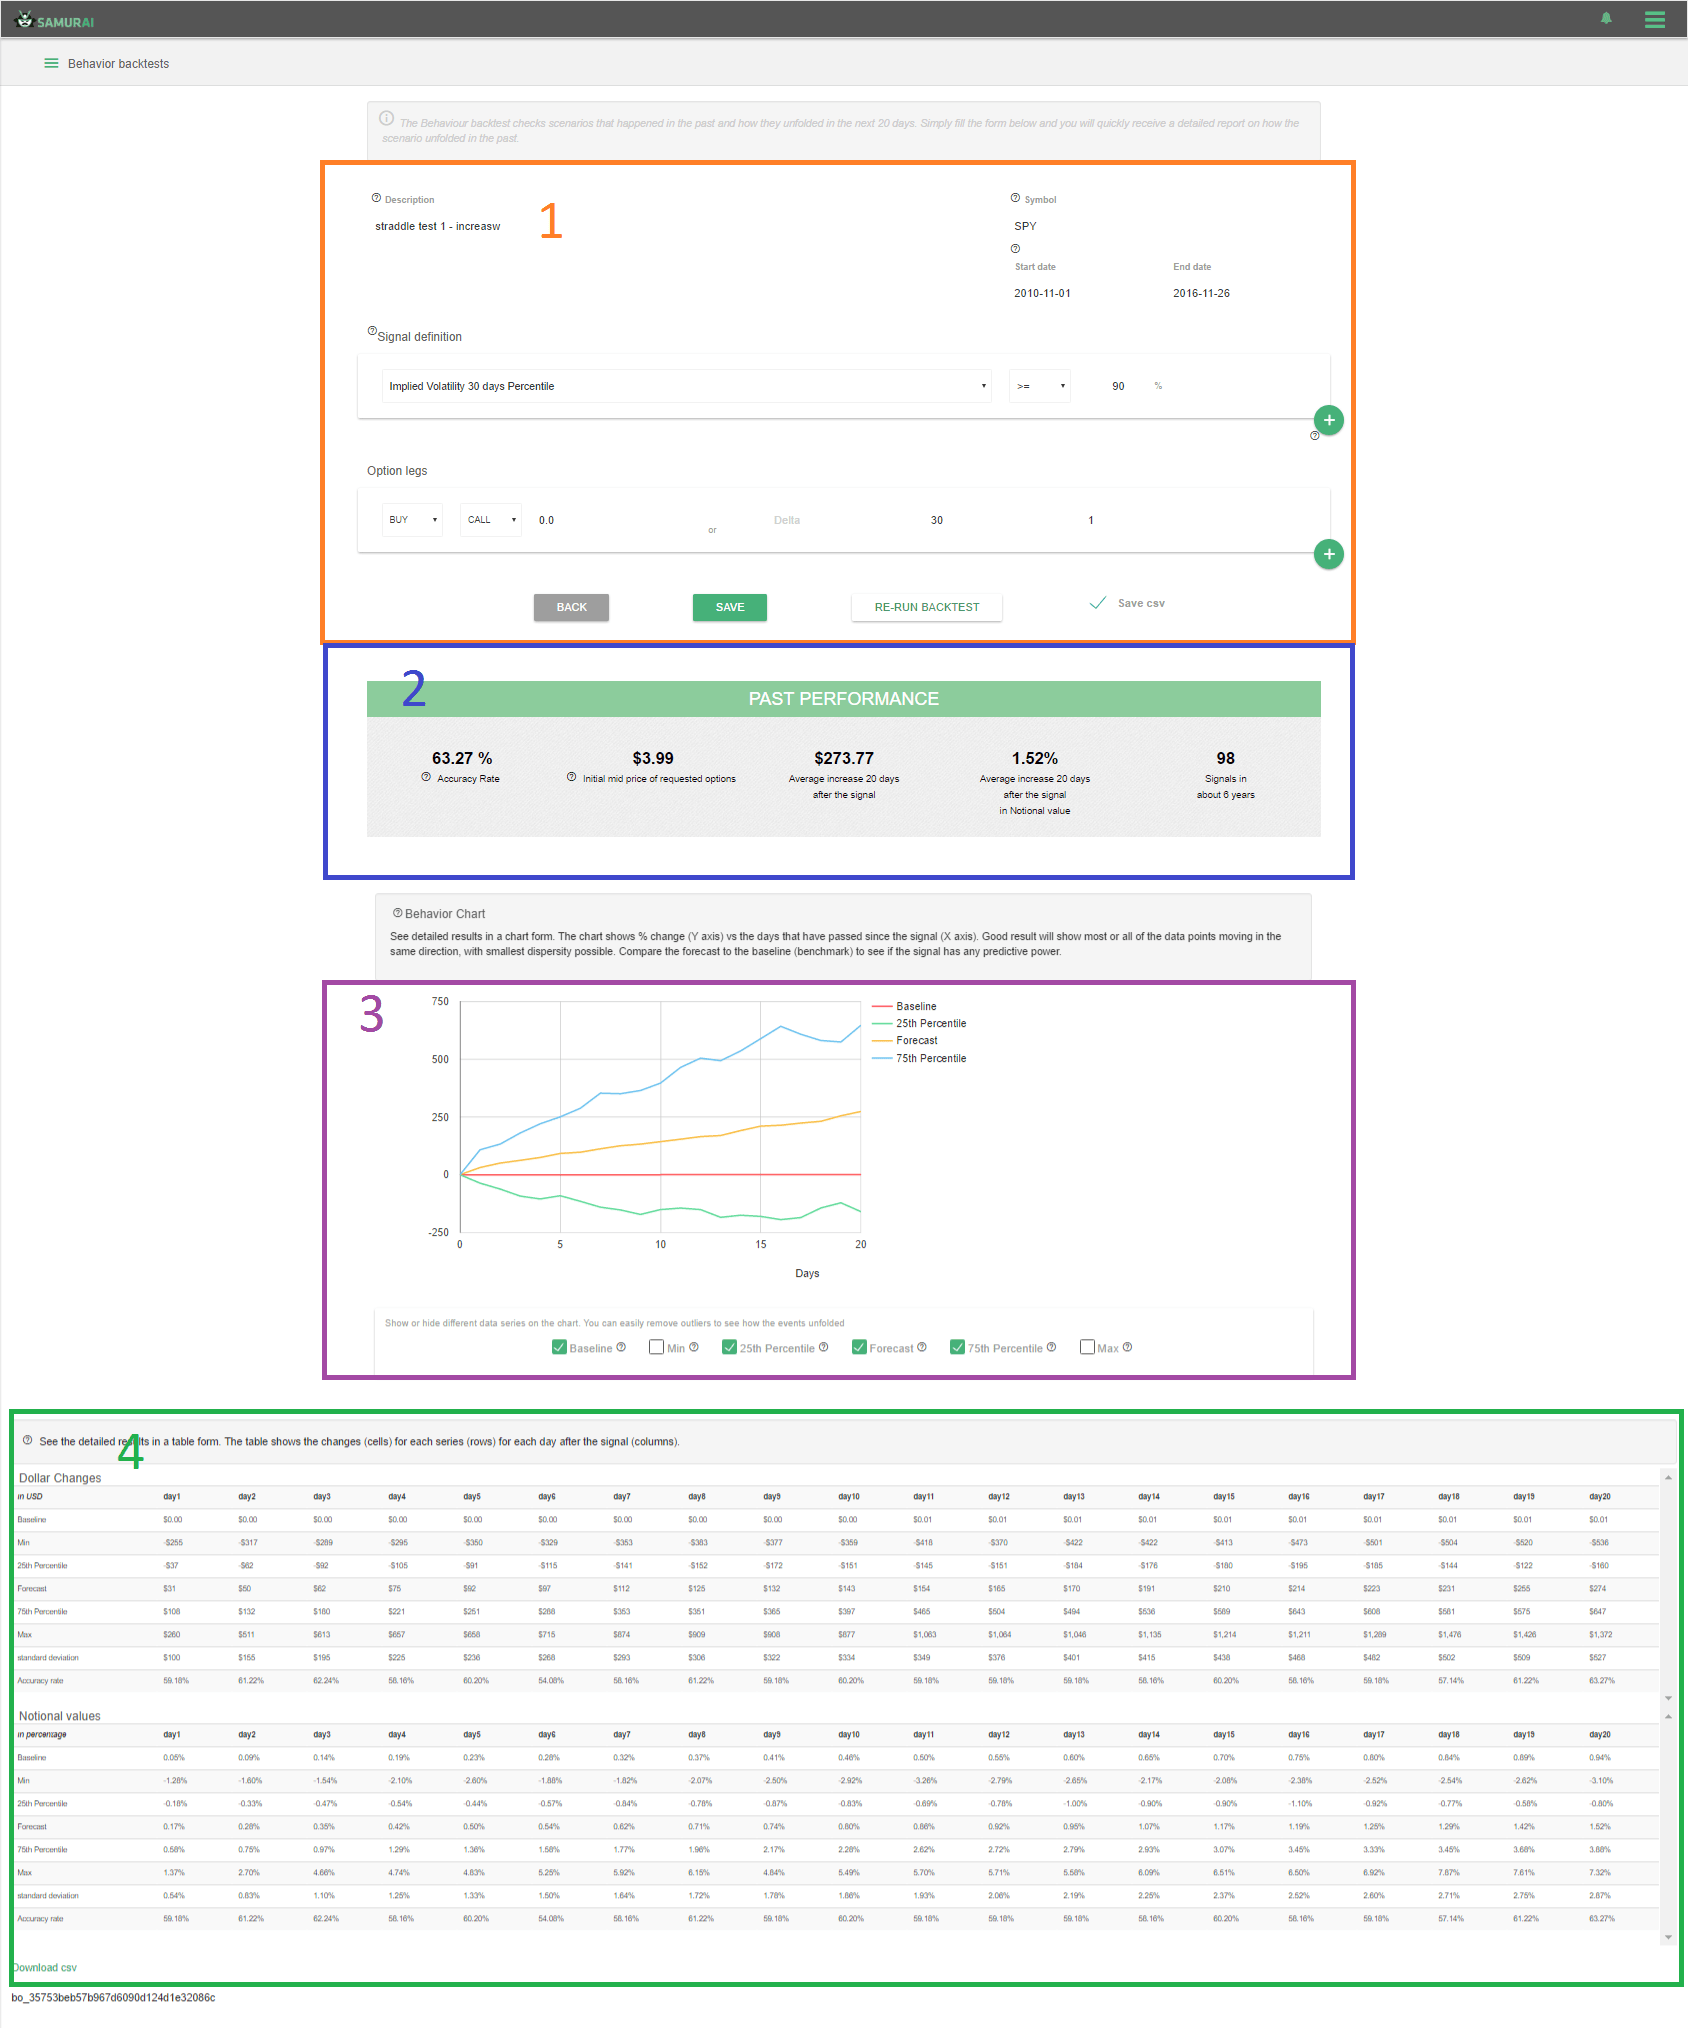
Section 1 – Controls
Our Options backtester is a scenario backtester. The methodology is to define a scenario and then see what happened to the stock / options after that.
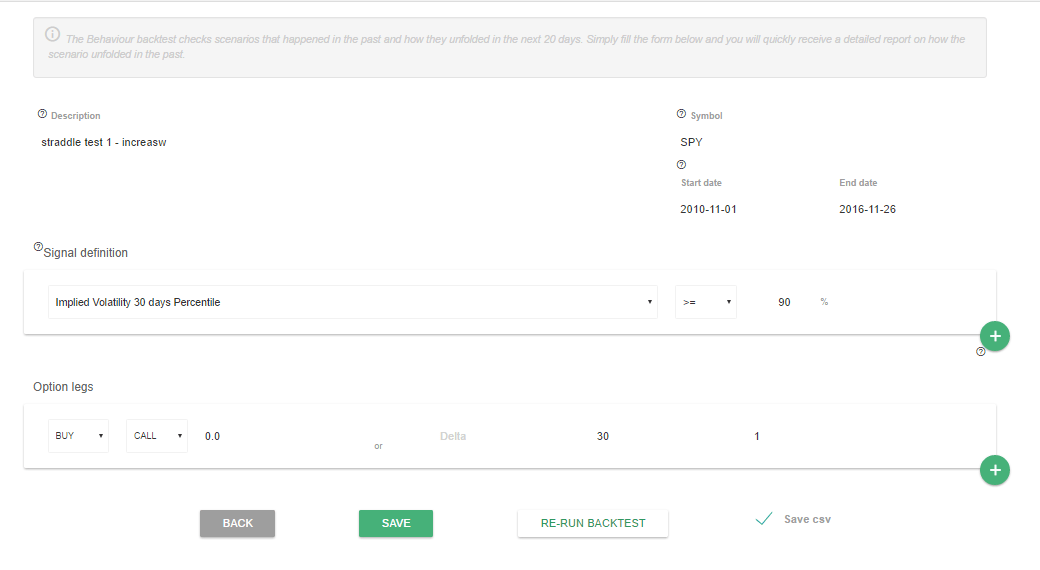
The available input:
- Name (will help you find the backtest and define the alert)
- Ticker – What stock you want to test
- Date – What is the time period to test
- Signal – you define what is the event. You can add as many conditions you want in an ‘and’ variation.
- Options strategy – once the event happens => what is the strategy you want to test. You can add many legs and test iron condors, straddles, risk reversals and more.
The backtest is running on Google infrastructure so can be done from any internet enabled device.
Section 2 – Summary results
We start by giving a very short summary of results to provide an overview if the signal carries any predictive power.
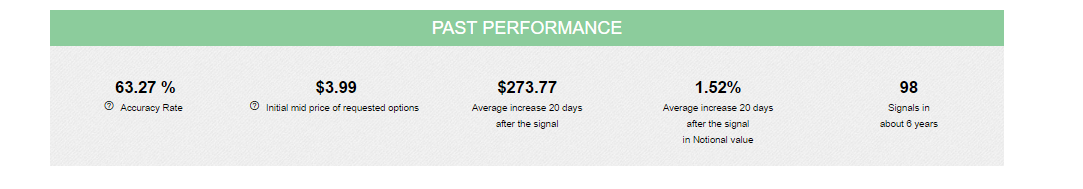
- Accuracy rate – How many profitable trades were in the backtest
- Initial cost of strategy – The average cost of initializing the trade
- Average profit in $
- Average increase in notional value (the notional value is the ‘un-leveraged’ value of the options)
- Number of signals in the time period.
Section 3 – Results graph
This section shows all the results on a chart. We standardize all trades where trade date is day0 and the day after is day1 and so on. The graph shows the options backtest results up to one month after the trade (20 trading days).
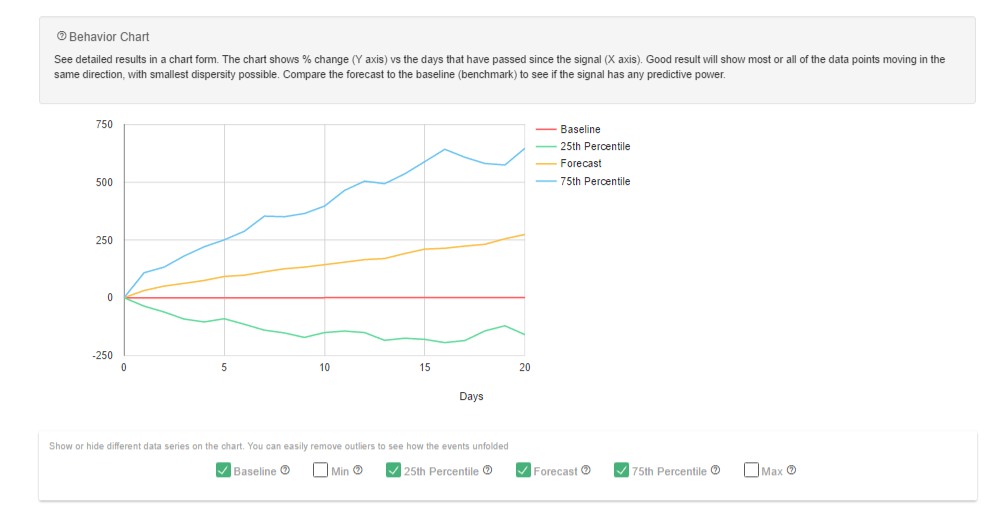
The result graph shows 6 data series:
- Baseline – Serves as a benchmark (usually the normal move of the stock)
- Min – The lowest outlier. This represents the lowest value for each day (biggest loss)
- 25th Percentile – Shows the 25th value for each day. For example: If we had 100 trades, the 25th percentile will be the value the 25 signals were losing more than it.
- Forecast – The average of all signals
- 75th percentile – Shows the 75th value for each day. For example: If we had 100 trades, the 75th percentile will be the value the 75 signals were losing more than it.
- Max – The highest outlier. This represents the highest value for each day (biggest win)
We show the 25th and 75th percentiles values, because the average can be skewed if the test has extreme outliers.
The percentiles are very useful as 50% of the trades were between the 25th and 75th percentiles bands, and 25% were below the lower band and 25% of the trades were above the upper band.
Section 4 – Results tables
The last section provides a more detailed view about the backtested results. You can see the details in Dollar change and in a percentage from (The percentage is in notional value).
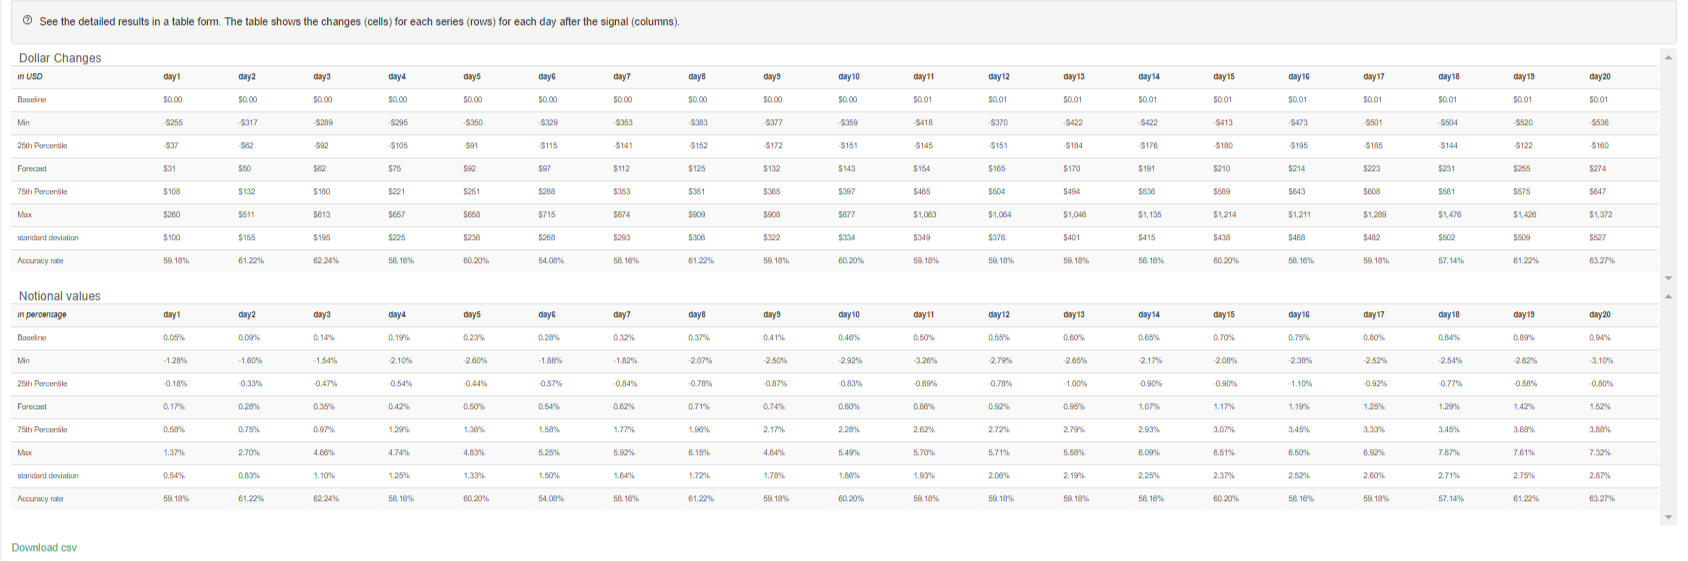
You can also export all the results to excel and analyse it from there.
Signup so SamurAI options backtester – Send us an email or check:
samurai.finance

