*Discontinued*
Chart your trade is a website dedicated to make individual investors more successful, using the CAN SLIM method. The site offers a lot of educational material, market commentary, stocks to watch and a community forum.
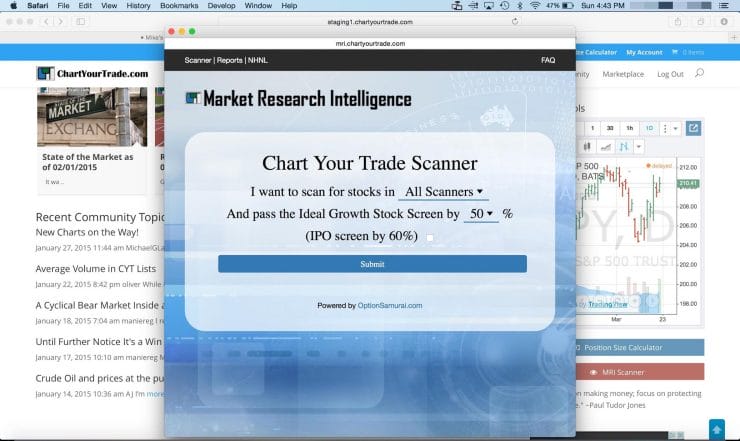
During the site redesign we worked with Mike and Gerik on building a better scanner to help traders find the best trades in seconds.
How does it work?
- We take fundamental and technical data for all stocks and scan the market in 8 different scanners. Each scanner is looking for a unique edge such as: High EPS growth, strong momentum, mutual funds interests etc.
- After compiling all the stocks that pass one or more of these scanners, we scan them again, This time for criteria making an “ideal growth stock”, such as: distance from 52 weeks high, volume, EPS and sales growth etc. (over all 17 tests).
- The unique point in the “ideal screen” is that stock doesn’t have to pass 100% of that screen. We can analyse stocks that pass this screen by 90% or 70% and still find amazing trade opportunities.
MRI features:
- Scan the whole market (twice) to find the best trades.
- Industry rotation report – allow you to focus on the best industry to trade.
- New High – New Low report to analyse market breadth.
- Responsive – Fits PCs, tablets and smartphones.
- Hover above a ticker to see chart for that ticker.
